Weekly Analysis Hints Bitcoin Price Could Reach $25000 In Near Future


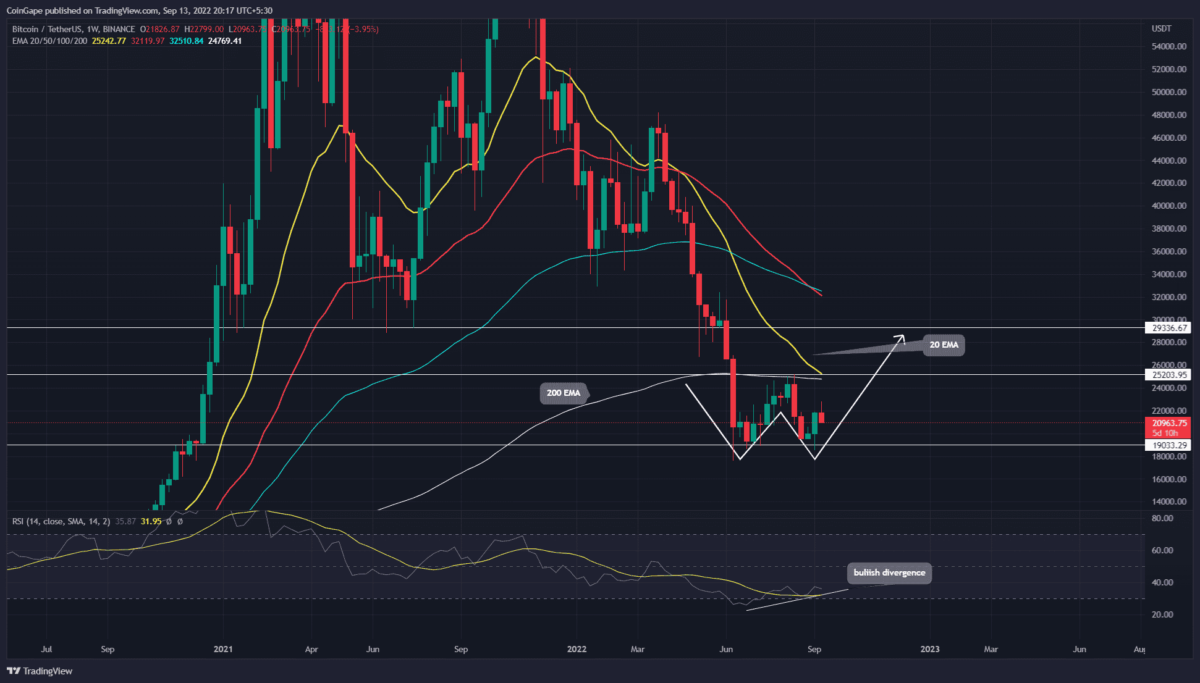
The Bitcoin technical chart shows the formation of a double bottom pattern in the weekly time frame chart. The base support for this pattern is at $19000 as the price has rebounded twice from this level in the past three months. However, can the current sell-off offset the near-term future goals of Bitcoin holders?
Key points
- The BTC price check buyer’s commitment at $20600 support
- The Weekly chart shows a bearish crossover of 50 and 100 EMAs
- The intraday trading volume in Bitcoin is $34.6 Billion, indicating a 10.5% loss
 Source-Tradingview
The double bottom pattern is often found in the market bottom and initiates a significant recovery if executed properly. Furthermore, the Bitcoin price currently trades at the $21028 mark, but under the influence of this pattern, it should rally to the neckline resistance of $25000.
A bullish breakout from this neckline resistance is crucial for coin holders as it will signal an early sign of trend reversal. The interest traders entering this trade could capture a rally to the $29300-$30000 mark.
Technical indicator in Weekly chart
EMAs: the 20 and 200 EMA wavering at the $25000 neckline make it a high area interest(AOI). These crucial technical levels accumulated at the same level suggest the price action at this mark will significantly influence Bitcoin’s future prices.
RSI: a bullish divergence in the RSI slope bolsters the completion of the double bottom pattern.
Can $20800 Support Prevent Further Downfall?
 Source-Tradingview
Today, Bitcoin faces sudden selling pressure as the fresh released consumer price Index(CPI) signals an 8.3% YoY inflation. Moreover, after this unfavorable CPI data, the interest rate hike of 1% seems likely.
As a result, the Bitcoin price is 6.6% down today and currently trades at the $20903 mark. However, the volume activity is low in comparison to the last six days of recovery of the Bitcoin price. Moreover, the coin price hit the combined support of $20800-$20600 and 20-day EMA, which should assist the buyers in fighting back.
Thus, if the Bitcoin price sustains above this support, the above bullish theory should do its work.
However, today’s candle closing is important, and a breakdown below the $20600 mark will pull the prices back to the $18830 mark.
- Resistance level- $22550 and $25000
- Support level- $20800 and $18830
Why Trust CoinGape
CoinGape has covered the cryptocurrency industry since 2017, aiming to provide informative insights Read more…to our readers. Our journal analysts bring years of experience in market analysis and blockchain technology to ensure factual accuracy and balanced reporting. By following our Editorial Policy, our writers verify every source, fact-check each story, rely on reputable sources, and attribute quotes and media correctly. We also follow a rigorous Review Methodology when evaluating exchanges and tools. From emerging blockchain projects and coin launches to industry events and technical developments, we cover all facets of the digital asset space with unwavering commitment to timely, relevant information.
Related Articles


- Fed Rate Cut Odds in January Crash to 99% Ahead of Dollar Yen Intervention- Will BTC React?
- New $2M Funding Reveals Ethereum Foundation’s New Threat
- U.S. Shutdown Odds Hit 78% as CLARITY Act Faces Fresh Uncertainty
- Bitcoin Sentiment Weakens BTC ETFs Lose $103M- Is A Crash Imminent?
- Trump Backed Rick Rieder Now Leads the Odds for New Fed Chair
- Bitcoin and XRP Price At Risk As US Govt. Shutdown Odds Reach 73%
- PEPE vs PENGUIN: Can Pengu Price Outperform Pepe Coin in 2026?
- Binance Coin Price Outlook As Grayscale Files S-1 for BNB
- Solana Price Prediction as SOL ETF Inflows Outpace BTC and ETH Together
- Bitcoin and Gold Outlook 2026: Warsh, Rieder Gain Traction in Trump’s Fed Pick
- PEPE Coin Price Eyes 45% Rebound as Buyers Regain Control on Spot Markets


