 Buy $GGs
What the New Bitcoin Model Predicts About a Possible $200K BTC Price Target?


Highlights
- The new Bitcoin model outlines a trend-based path that places a $200K zone within reach.
- Citigroup’s $231K projection reinforces the model’s outlook and supports a stronger macro case.
- BTC trades inside a descending channel that now forms a potential reversal base for recovery.
The Bitcoin price dropped below the $100K mark after a sharp wave of selling hit major assets across the board. Panic selling drove BTC down as buyers had a hard time to regain lost form. Interest continues to grow around the new Bitcoin model, which outlines a path toward the $200K region over the next twelve months.
The framework emphasizes lower risk of downside and positioning in the early cycle that tends to be followed by stronger expansions. These indicators become important as the market wants to have some clarity following the volatility today. Bitcoin is at a crossroads at the moment when the mid-term direction may take shape.
Bitcoin Price Model Analysis Shows a Clear $200K Equilibrium Zone
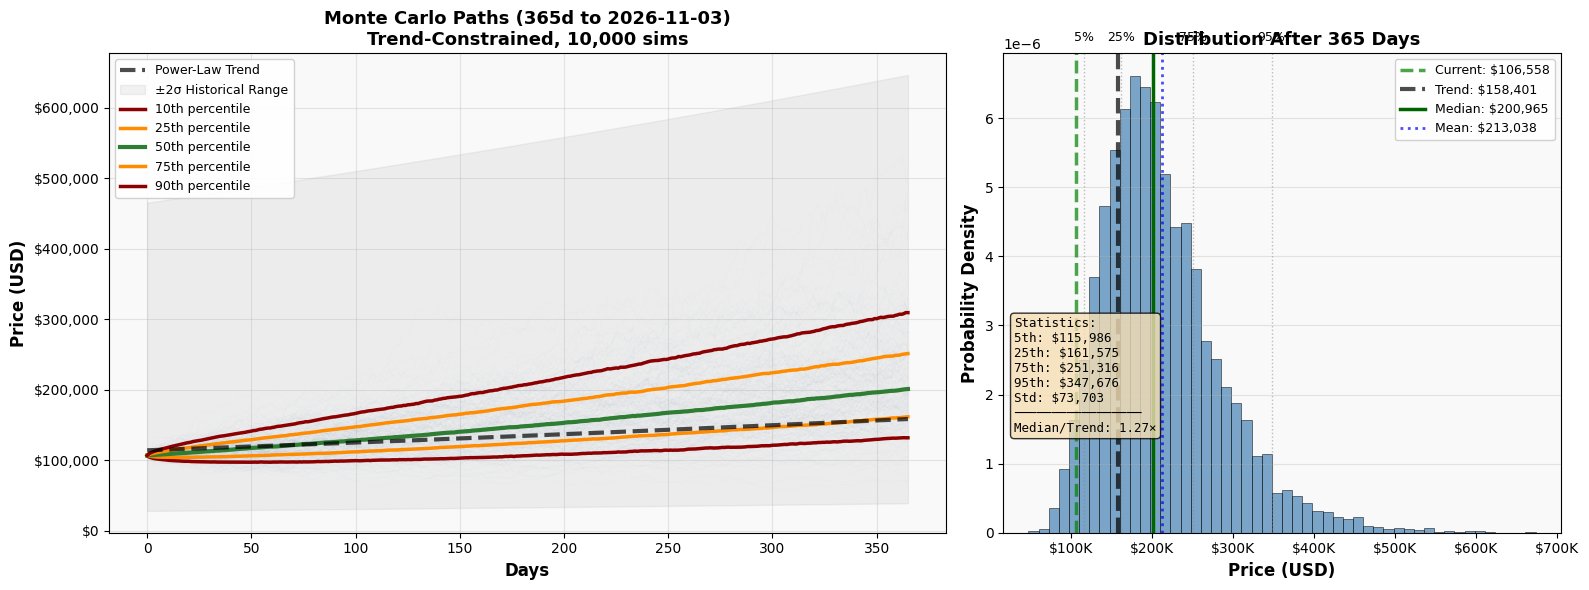
The new Bitcoin model outlines BTC price performance through a trend-constrained framework shaped by long-term power-law behavior. It shows BTC price trading at a 0.93x trend reading, which signals early accumulation with strong upside potential.
Notably, volatility is still dying out, and this lowers tail risk and promotes healthier expansion periods. These factors provide a framework in which Bitcoin will be strengthened by compression and then bigger swings will emerge.
According to the distribution plot, the median projection of the model is around the range of 200K within the coming twelve months. That median is created within a zone of equilibrium in which historical expansions tend to start.
The average is above 213K and creates additional momentum towards a bullish mid-term forecast. At the same time, the 75 th percentile is drifting over 250K and indicates broader upside skew in times of faster adoption.
These indicators put into perspective a definite probability bias towards an upward extension in the following cycle. The BTC price performance therefore aligns with a model that rewards early positioning. This further reinforces the argument that the next equilibrium will see Bitcoin reach the 200K mark.
Citigroup’s $231K Forecast Reinforces the Model’s $200K Outlook
Citigroup recently predicted that Bitcoin could climb toward $231,000 within the next twelve months, and that outlook supports the model’s $200K projection. Their bull case puts BTC above its current range and their base case is close to $181,000 which is just near the median path of the model.
Besides, Citigroup is also anticipating more institutional flows and this enhances the likelihood of achieving the $200K equilibrium zone as indicated by the model. The two sides of the argument intersect since they have similar drivers that comprise growth in adoption, decreased downside stress and the growing macro demand.
How Is the Current BTC Structure Shaping Its Next Move?
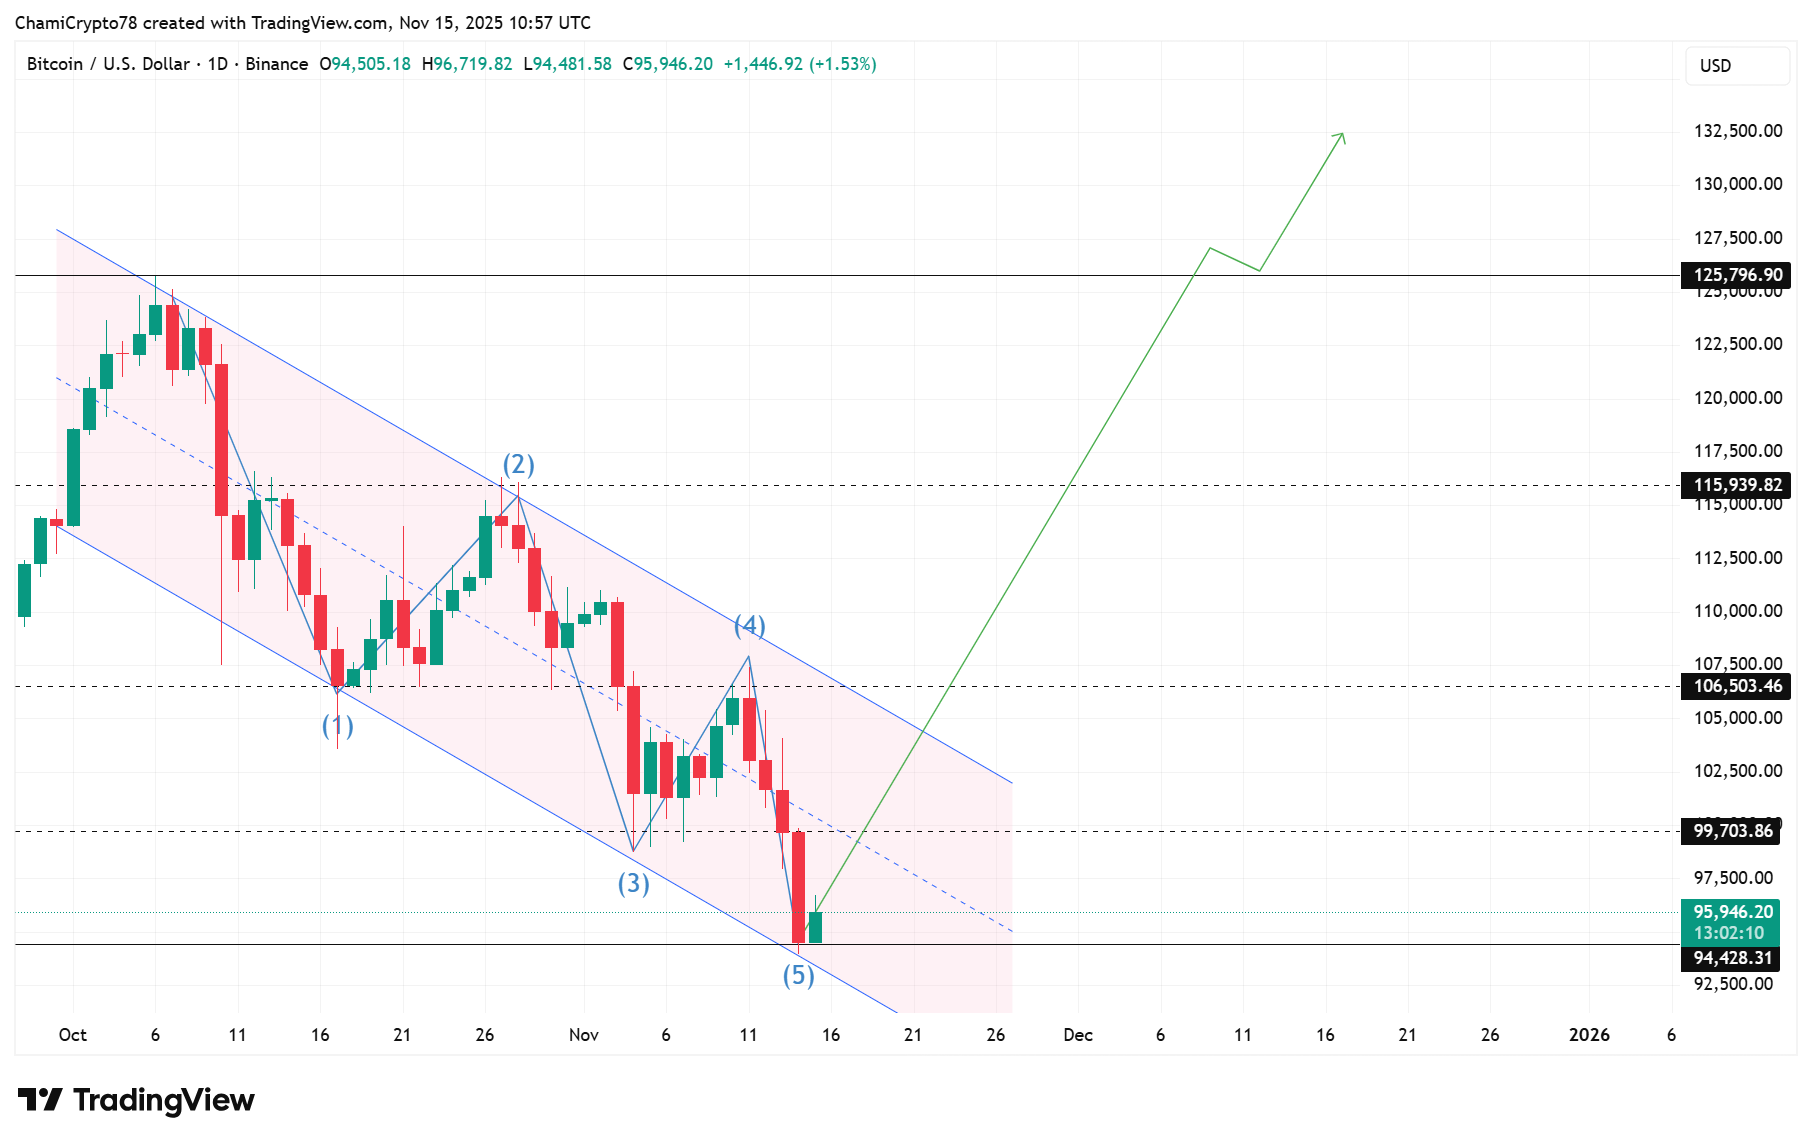
The BTC price continues to move inside a descending channel that shaped every leg of the recent pullback. Price tagged the channel floor this week after a steep slide that briefly forced Bitcoin below $100K, despite the reopening of the U.S. government.
Notably, buyers responded at that point and created a very powerful wick that validated the fifth Elliott wave. The fifth wave was the end of a clean series in which the first wave started the decline and the second wave formed a sharp rebound.
Wave three moved aggressively and penetrated through a number of intraday areas and then stopped at the 107K area. The fourth wave formed a small bounce that stopped short of the midpoint of the channel and did not manage to rise above it.
At last, the fifth wave finished the last leg with a decisive tap at the boundary which now constitutes a significant support. The BTC price now eyes $99,703 before targeting $106,503 and then $115,939 if strength persists.
A clean break above such levels would trigger a bigger direction to the short run to $125,796. This framework is consistent with the upward projections of the model and a wider recovery thesis. The congruence between price model and model perspective reinforces the case of a short-term change.
To conclude, The new Bitcoin model outlines a strong macro path toward the $200K region and sets the foundation for a bullish long-term outlook. Citigroup reinforces this forecast with its 231K forecast, which is within the range of equilibrium of the model.
Currently, BTC is responding to a major structural floor on which reversals tend to start in major cycles. In case buyers protect these levels and re-establish mid-range barriers, the subsequent expansion stage may emerge.
Play 10,000+ Casino Games at BC Game with Ease
- Instant Deposits And Withdrawals
- Crypto Casino And Sports Betting
- Exclusive Bonuses And Rewards

Frequently Asked Questions (FAQs)
1. What does the new Bitcoin model focus on?
2. Why does Citigroup’s forecast matter in this discussion?
3. How does the channel structure contribute to Bitcoin’s broader outlook?

Why Trust CoinGape
CoinGape has covered the cryptocurrency industry since 2017, aiming to provide informative insights Read more…to our readers. Our journal analysts bring years of experience in market analysis and blockchain technology to ensure factual accuracy and balanced reporting. By following our Editorial Policy, our writers verify every source, fact-check each story, rely on reputable sources, and attribute quotes and media correctly. We also follow a rigorous Review Methodology when evaluating exchanges and tools. From emerging blockchain projects and coin launches to industry events and technical developments, we cover all facets of the digital asset space with unwavering commitment to timely, relevant information.

Related Articles


- Crypto Market Update: Top 3 Reasons Why BTC, ETH, XRP and ADA is Up
- Crypto News: Bitcoin Sell-Off Fears Rise as War Threatens Iran’s BTC Mining Operations
- U.S.–Iran War: Monday Crypto Crash Odds Rise As Pundits Predict Oil Price Spike
- US-Iran War: Reports Confirm Bombings In UAE, Bahrain and Kuwait As Crypto Market Makes Recovery
- XRP Price Dips on US-Iran Conflict, But Capitulation Signals March Rebound
- Bitcoin And XRP Price As US Kills Iran Supreme Leader- Is A Crypto Crash Ahead?
- Gold Price Prediction 2026: Analysts Expect Gold to Reach $6,300 This Year
- Circle (CRCL) Stock Price Prediction as Today is the CLARITY Act Deadline
- Analysts Predict Where XRP Price Could Close This Week – March 2026
- Top Analyst Predicts Pi Network Price Bottom, Flags Key Catalysts
- Will Ethereum Price Hold $1,900 Level After Five Weeks of $563M ETF Selling?


