 Buy $GGs
What to Expect From BTC Price as Open Interest Skyrockets to $75B Ahead of US CPI


Highlights
- Bitcoin's open interest has surged to a record $75 billion, indicating heightened trader activity and potential volatility.
- A hotter-than-expected CPI could push Bitcoin's price to $105,600 or lower, while a softer reading might propel it past $110,653.
- Trump's tariffs could amplify inflation risks, influencing Bitcoin's role as a potential hedge.
As of June 11, BTC price trades just under $110,000, having dropped 0.50% today. With Open Interest (OI) reaching $75 billion, investors appear to be preparing for the release of the US Consumer Price Index (CPI) data today at 8:30 a.m. EST. The staggering OI is just $5 billion shy of hitting the all-time high level of $81 billion, signalling potential volatility ahead of a key macroeconomic event. What can Bitcoin traders expect ahead of the US inflation data?
Bitcoin Price Overview: Open Interest Spikes to $75B Ahead of US Inflation Data
BTC price journey has been a rollercoaster as it dropped 10.41% to $100,305, hitting an all-time high (ATH) of $112,000 on May 21, 2025. Following the brutal sell-off that liquidated billions of leveraged positions, Bitcoin rebounded 11% to reach a local high of $110,653 on June 9, 2025.
Following this top, BTC price created a dragonfly doji on June 10, 2025. This is a top reversal candlestick pattern, signaling a potential correction. This technical setup, paired with Bitcoin’s open interest climbing to $75 billion, suggests that traders are positioning for a significant move. For US-based traders, the US CPI impact on Bitcoin could be the catalyst that determines whether BTC pushes higher or pulls back.

How Will BTC Price React to Today’s US CPI Release
The May 2025 CPI report is expected to shed light on how Trump’s tariff policies have impacted the US inflation trends.
Analysts at TD Securities forecast a 0.23% month-over-month increase in core CPI. The headline inflation slowed to 2.4% year-over-year due to a significant drop in gas prices. They noted, “Signs of tariffs pass-through start to emerge,” hinting at potential inflationary pressures from trade policies. Core CPI, which excludes volatile food and energy prices, is projected at 2.9% year-over-year.
Depending on how the US inflation data lands – hotter, cooler, or as expected could sway investor sentiment and BTC’s price trajectory.
Hotter-than-expected CPI:
- If core CPI exceeds 0.23% m/m, it could signal stubborn inflation, potentially prompting a hawkish Federal Reserve response and delaying rate cuts.
- This might dampen risk appetite, triggering a sell-off in Bitcoin and other risk assets. In this case, BTC could fall to test Bitcoin support levels at $105,600, a critical zone backed by the quarterly VWAP’s upper band and the current month’s VWAP. A deeper correction might target $104,700, where a naked point of control (nPOC) sits.
Lower-than-expected CPI:
- A reading below 0.23% m/m could ease inflation fears, fostering a dovish Fed outlook and boosting risk assets.
- Bitcoin price might rally past its recent high of $110,653, potentially retesting the $112,000 all-time high or climbing higher.
CPI meets expectations:
- If CPI aligns with the 0.23% m/m forecast, the market reaction could be muted.
- BTC price might consolidate, trading between support at $105,600 and resistance at $110,653 or continue its recovery rally.
The longer-term wildcard is Trump’s tariffs, which could fuel inflation in the months ahead, adding another layer of complexity to Bitcoin’s price dynamics.
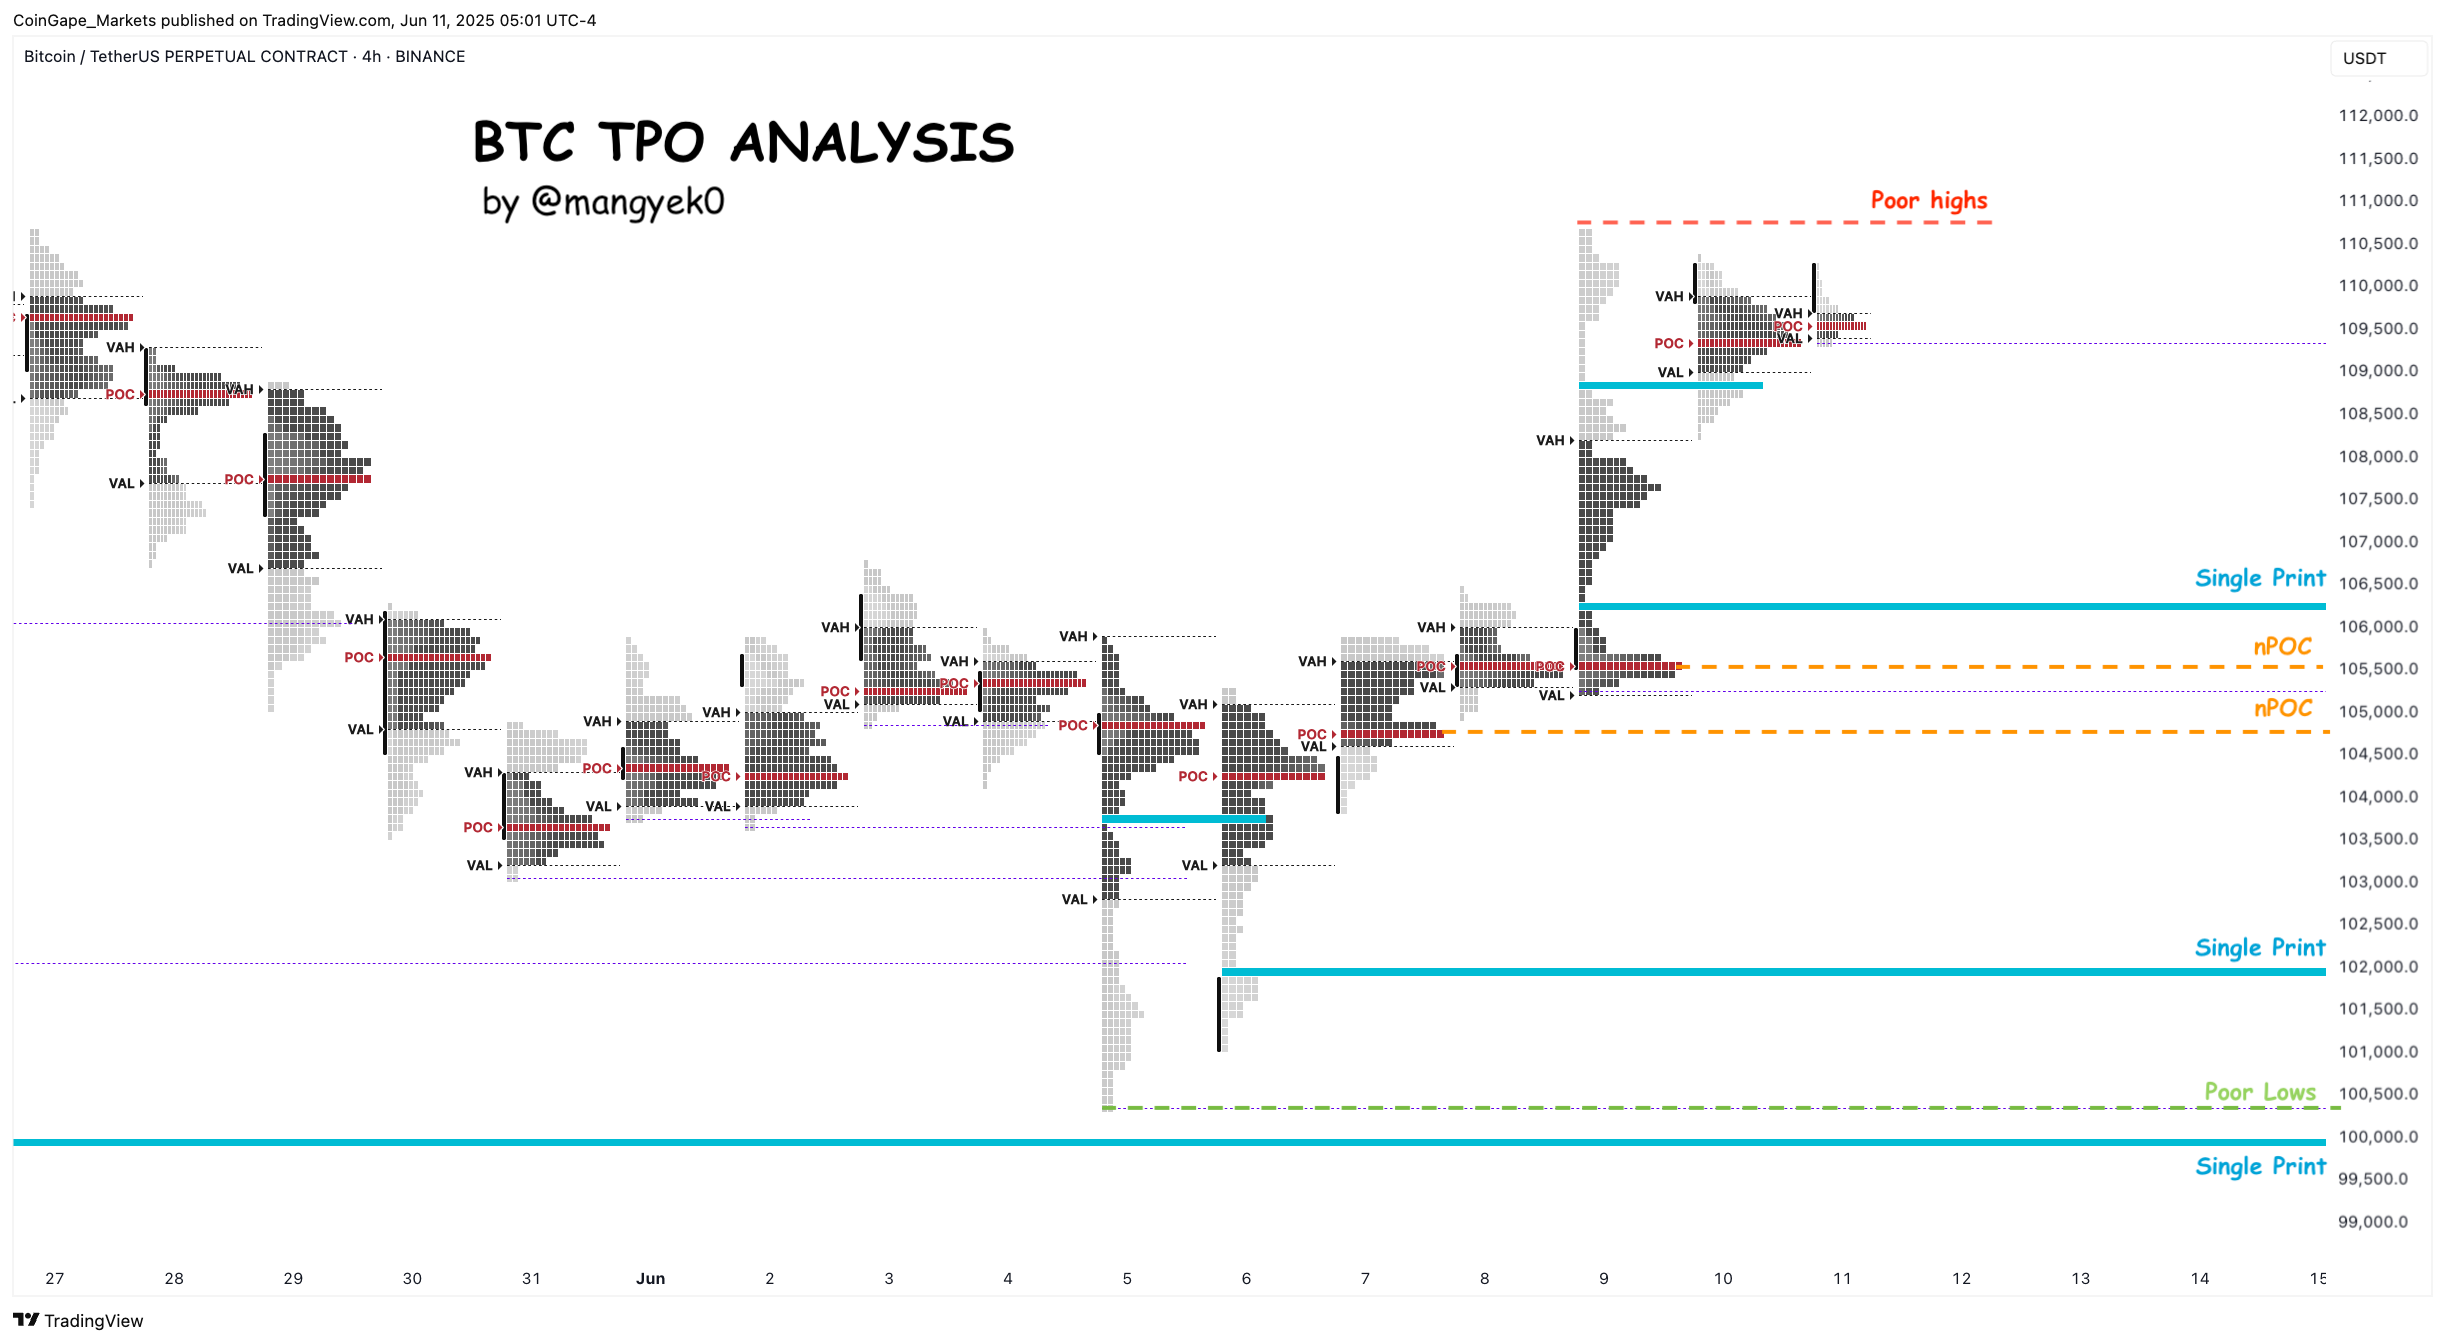
BTC Price Analysis: Key Levels to Monitor
This BTC price analysis highlights pivotal levels by examining the daily candlestick and the 4-hour Time Price Opportunity (TPO) charts for Bitcoin.
The daily chart is leaning bearish due to the dragonfly doji formation on June 10, 2025. This setup hints at a possible correction to key Bitcoin support levels at $105,600, which is a confluence of the quarterly and monthly VWAPs. A break below this level could see BTC slide to an nPOC at $104,700.
nPOCs are the highest trading volume levels that have resulted in an impulsive move and have not been retested.
The 4-hour TPO chart provides a more nuanced outlook with a potential sweep of equal or poor highs at $110,653 catalyzing a short-term pullback.
In case of this minor correction, the key support zones ranges from $106,400 to $106,100. This inefficiency is termed a single print and occurs when a spike in buying pressure results in an impulsive move to the upside, leaving behind gaps. A retest of this gap will allow unfilled buy orders to spark a bounce. Following the single print is the nPOCs at $105,500 and $104,700.
If these levels hold, BTC could rebound toward $112,000 and potentially attempt to set a new all-time high.
What’s Next for Bitcoin?
The uptick in Bitcoin open interest to $75 billion, combined with the upcoming CPI release, sets the stage for a volatile BTC price move. If the US inflation data comes in hotter than expected, it could push the Bitcoin (BTC) price toward $105,600 or lower. On the contrary, a softer reading might propel it past $110,653 to challenge the $112,000 mark. A stalemate outcome would evolve if the data meets expectations, catalyzing a range-bound trading for Bitcoin.
Investors should also pay attention to Trump’s tariffs as they could amplify inflation risks, influencing Bitcoin’s role as a potential hedge.
In case of a steep correction, Peter Brandt, a veteran trader, highlights a deep correction scenario. He noted that Bitcoin could crash 75% if it rhymes with the 2022 fractal.
Conclusion
For traders, the BTC price analysis is important as it highlights $105,600 as a key support level and $110,653 as near-term resistance. The US CPI impact on Bitcoin is contingent on the US inflation data. With $75 billion in open interest, the stakes are high, and investors can expect volatile moves as Bitcoin is trading just below the key $110,000 and $112,000 ATH levels.
For a long-term price prediction surrounding Bitcoin (BTC): Check This
Play 10,000+ Casino Games at BC Game with Ease
- Instant Deposits And Withdrawals
- Crypto Casino And Sports Betting
- Exclusive Bonuses And Rewards

Frequently Asked Questions (FAQs)
1. What is Bitcoin's current price?
2. What could impact Bitcoin's price today?
3. What are the key support and resistance levels?

Why Trust CoinGape
CoinGape has covered the cryptocurrency industry since 2017, aiming to provide informative insights Read more…to our readers. Our journal analysts bring years of experience in market analysis and blockchain technology to ensure factual accuracy and balanced reporting. By following our Editorial Policy, our writers verify every source, fact-check each story, rely on reputable sources, and attribute quotes and media correctly. We also follow a rigorous Review Methodology when evaluating exchanges and tools. From emerging blockchain projects and coin launches to industry events and technical developments, we cover all facets of the digital asset space with unwavering commitment to timely, relevant information.

Related Articles


- Senate Eyes CLARITY Act Markup This Month as Banks, Crypto Continue Stablecoin Yield Talks
- Why XRP Price Rising Today? (2 March)
- Breaking: Bitcoin Price Rises to $70k as Gold Crashes Amid U.S.-Iran Conflict
- Bitcoin News: Anthony Pompliano’s ProCap Buys 450 BTC, Gold Bug Peter Schiff Reacts
- Fed Rate Cuts More Likely If U.S.-Iran Conflict Extends, Arthur Hayes Predicts
- Top 5 Historical Reasons Dogecoin Price Is Not Rising
- Pi Coin Price Prediction for March 2026 Amid Network Upgrade, KYC Boost, Rewards Distribution
- Gold Price Nears ATH; Silver Eyes $100 Breakout on Us- Iran War
- Bitcoin And XRP Price As US Kills Iran Supreme Leader- Is A Crypto Crash Ahead?
- Gold Price Prediction 2026: Analysts Expect Gold to Reach $6,300 This Year
- Circle (CRCL) Stock Price Prediction as Today is the CLARITY Act Deadline


