What to Expect from Ethereum Price as ETH/BTC Tests 2021 Bull Market Support


Highlights
- Ethereum price eyes a recovery as the ETH/BTC ratio bounces from the 2021 bull market support of 0.017.
- The last ETH price bounced from this support was during the 2020/2021 bull market, which triggered an over 4,000% rally.
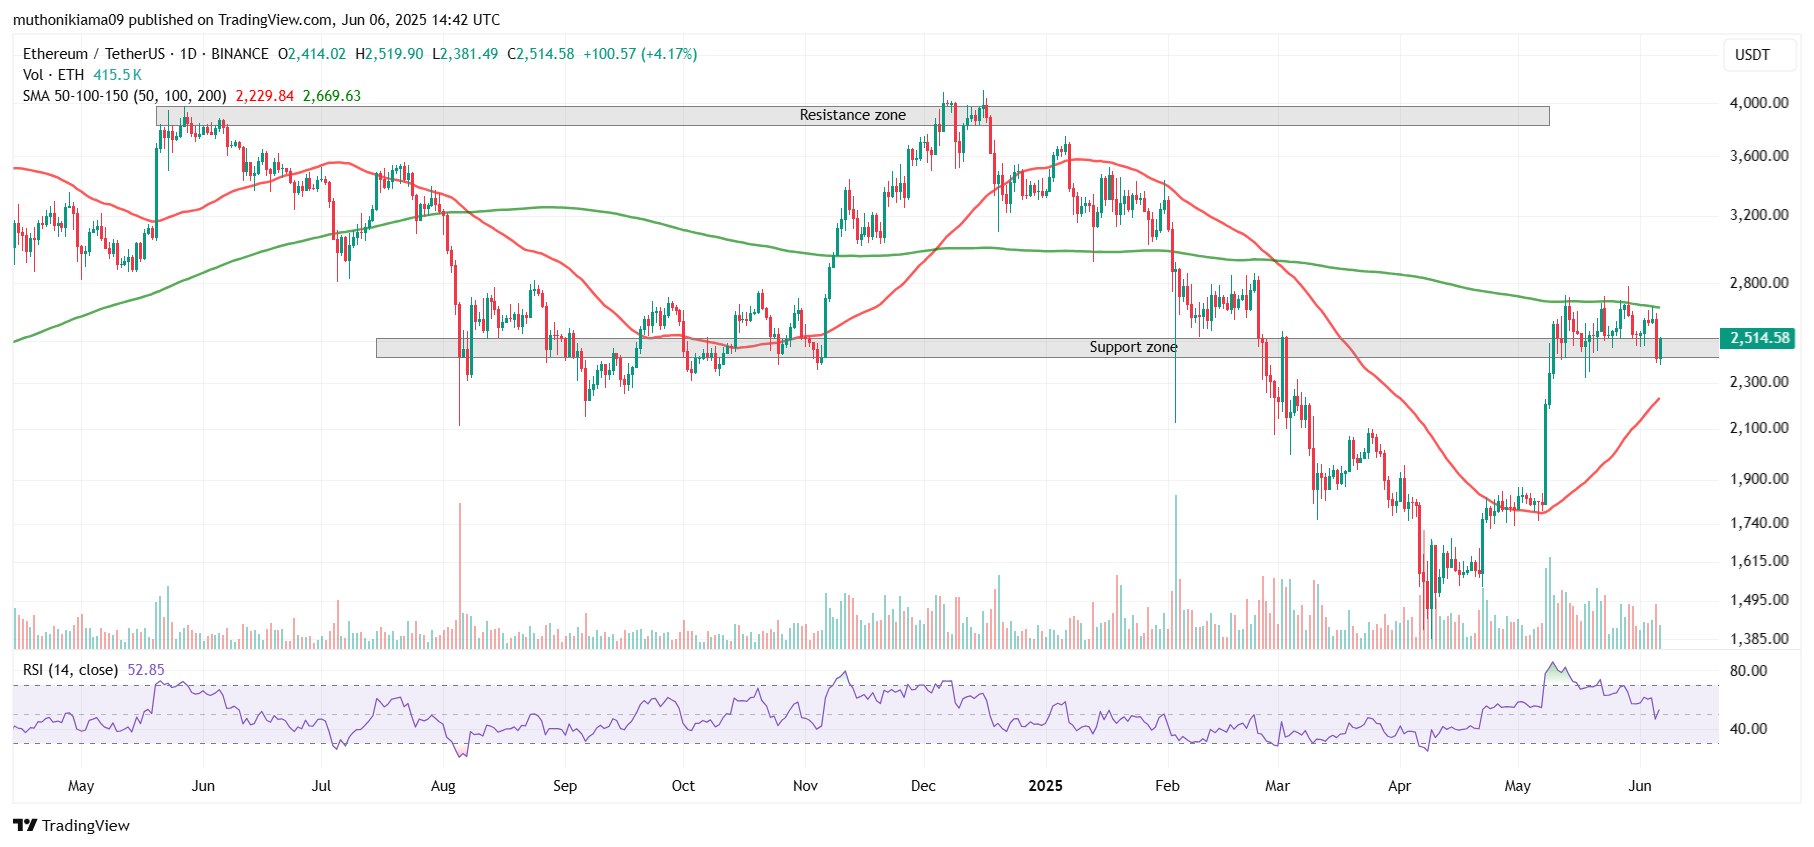
- Ethereum price faces critical resistance at the 200-day SMA level of $2,669 before the next bull run.
Ethereum (ETH) is down 5% in 24 hours amid a widespread crash across the broader cryptocurrency market. However, the ETH/BTC ratio has dropped to test the 2021 bull market support that catalyzed an over 4,000% rally. As this ratio rises, what does it mean for Ethereum price, and can the largest altcoin reclaim $4,000?
Ethereum Price Outlook as ETH/BTC Tests Support
ETH price trades at $2,513 at press time, with the dip threatening to wipe out the gains that the altcoin recorded in May 2025. However, despite the ongoing dip, the market sentiment towards ETH remains high as institutional inflows shift from Bitcoin to Ethereum.
The dip has also caused the ETH/BTC ratio to fall to a critical support level of 0.017, which triggered an over 20x rally for Ethereum price during the 2021 bull market. The trend appears to be repeating again as the ratio forms an upward trend since its drop to this range.
For this ratio to confirm the upward trend and the start of a 2021-like bull market for Ethereum price, it first needs to overcome resistance at the 61.8% Fibonacci level of $0.0422. Bouncing from this level may then result in a 2x rally to 0.082, marking the highest level since September 2022. However, the upward trend portrayed in the ETH/BTC ratio is facing weakness, as the downward sloping ADX line shows.
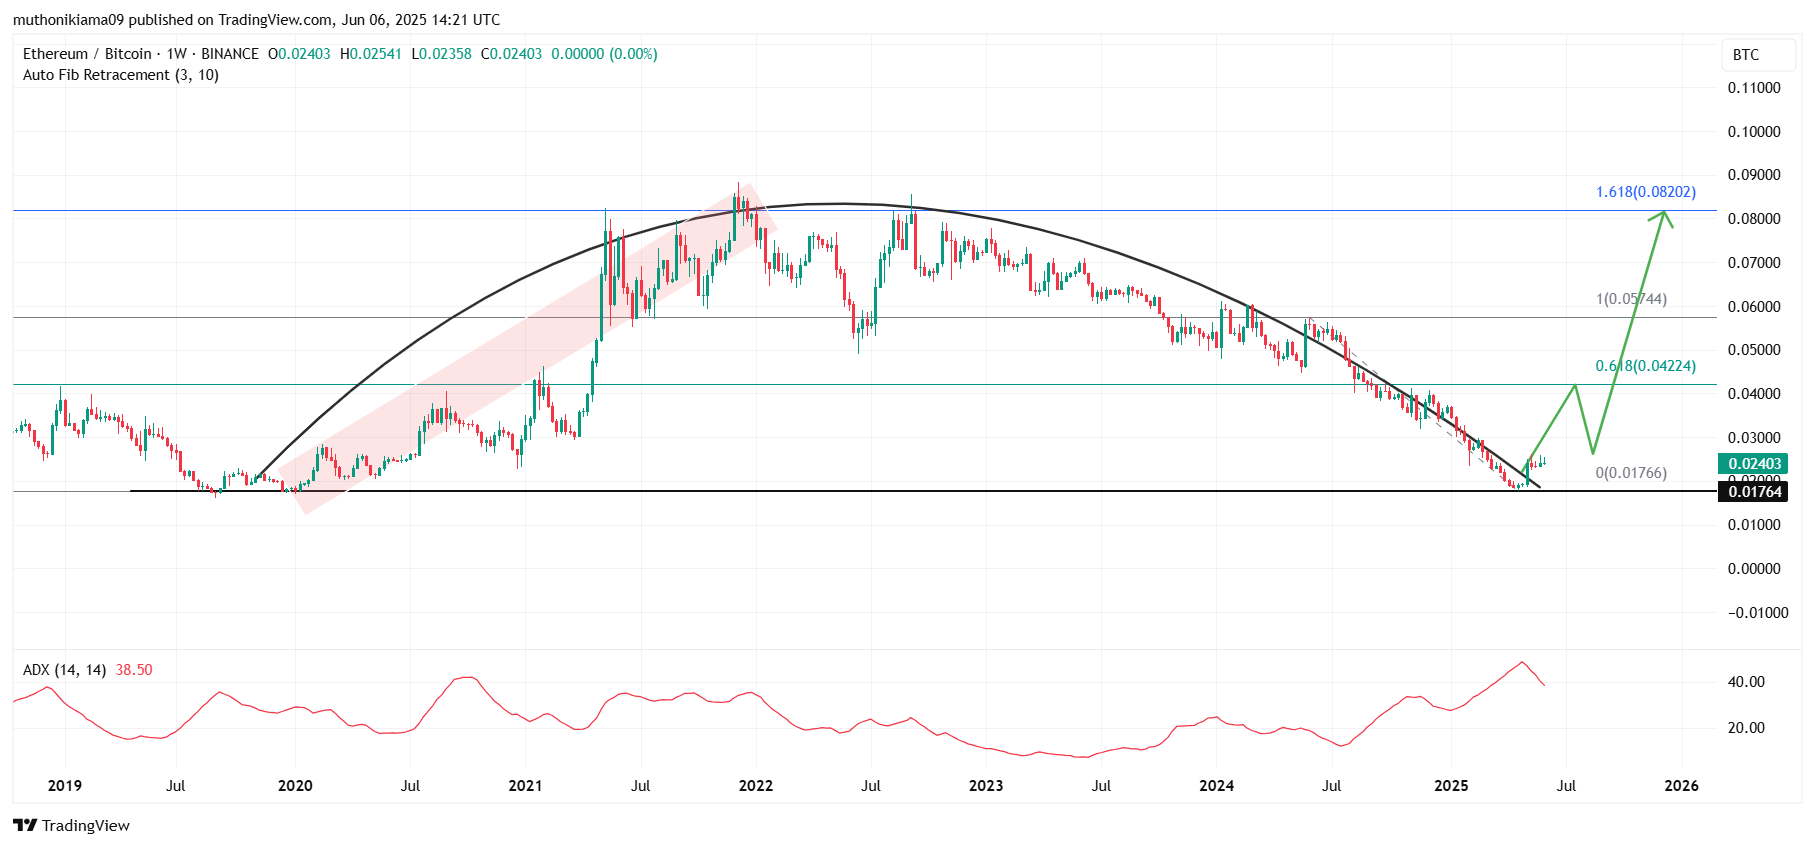
The last time that the ETH/BTC ratio bounced from this support, it catalyzed an over 4,000% rally in Ethereum. However, considering the growth in Ethereum’s market cap, traders may expect a 2x rally in ETH price if history rhymes, pushing it past $4,000.
Key Levels to Watch in Ethereum Price
Amid the surging ETH/BTC ratio, the daily price chart shows that the price of Ethereum is at a pivotal point as it defends a crucial support zone. The $2,400 to $2,550 range has been acting as a strong support level for Ethereum, and a breakout has always determined whether the price rallies or crashes.
If ETH bounces from this support, the first resistance it needs to break is the 200-day SMA level of $2,669. Breaking above this level will confirm a long-term bullish outlook and support a strong uptrend. This may then push ETH price to the resistance zone between $3,800 and $3,900 and kickstart a bull run past $4,000.
This bullish forecast aligns with a recent CoinGape analysis that observed the formation of a bull flag pattern on the Ethereum chart. A breakout from this pattern suggests that the Ethereum price could rally to $4,000.
Bottomline
Ethereum price may be on the verge of a rally after the ETH/BTC ratio bounced from a support level that catalyzed an over 4,000% gain for ETH in 2021. If Ethereum can cross above the 200-day SMA level, it may spark a notable rally.
For a more detailed prediction on how Ethereum price will perform between 2025 and 2030 – Read This.
Frequently Asked Questions (FAQs)
1. How will Ethereum price react as ETH/BTC bounces from support?
2. Can Ethereum outperform Bitcoin?
3. What is the key resistance level for Ethereum price?

Why Trust CoinGape
CoinGape has covered the cryptocurrency industry since 2017, aiming to provide informative insights Read more…to our readers. Our journal analysts bring years of experience in market analysis and blockchain technology to ensure factual accuracy and balanced reporting. By following our Editorial Policy, our writers verify every source, fact-check each story, rely on reputable sources, and attribute quotes and media correctly. We also follow a rigorous Review Methodology when evaluating exchanges and tools. From emerging blockchain projects and coin launches to industry events and technical developments, we cover all facets of the digital asset space with unwavering commitment to timely, relevant information.

Related Articles


- Crypto Market in Panic Mode Ahead of Bitcoin, ETH, XRP, SOL Options Expiry & US CPI Today
- Digital Assets Are Fixed In The Future Of Traditional Finance
- U.S. CFTC Committee Appoint Ripple, Coinbase, Robinhood CEOs to Boost Crypto Regulation
- What Will Spark the Next Bitcoin Bull Market? Bitwise CIO Names 4 Factors
- U.S. CPI Release: Wall Street Predicts Soft Inflation Reading as Crypto Market Holds Steady
- Solana Price Prediction as $2.6 Trillion Citi Expands Tokenized Products to SOL
- Bitcoin Price Could Fall to $50,000, Standard Chartered Says — Is a Crash Coming?
- Cardano Price Prediction Ahead of Midnight Mainnet Launch
- Pi Network Price Prediction as Mainnet Upgrade Deadline Nears on Feb 15
- XRP Price Outlook Amid XRP Community Day 2026
- Ethereum Price at Risk of a 30% Crash as Futures Open Interest Dive During the Crypto Winter


