What’s Ahead for BTC Price After a Break Below 200-day Moving Average?


The ongoing correction trend in BTC price can be followed using a downsloping trendline which started its journey in mid-July. On October 8th, the coin price witnessed its latest reversal from the dynamic resistance which also poured additional supply pressure in the crypto market. This newfound correction breaking below the $27000 mark indicates the current downfall could extend to the $25000 mark.
Also Read: Odds Of Spot Bitcoin ETF Approval By US SEC Rises Above 90%: Bloomberg
Is BTC Price Heading to $25000?
- The BTC price break below key support suggests a quick 7.5% drop
- A potential death crossover between the 50-and-100-day EMAs could intensify the bearish momentum.
- The intraday trading volume in Bitcoin is $7.7 Billion, indicating a 43% loss.
 Source-Tradingview
On October 8th, the Bitcoin price showcased its 4th reversal from the overhead resistance trendline which led to a 4% drop to the current trading price of 26,969. As per previous records, each rejection from this dynamic resistance has led to a significant downfall in the coin’s market value.
Amid the ongoing downfall, the BTC price has recently breached the combined support of a new emerging ascending trendline and the 200-day EMA slope on October 11th. This breakdown offers sellers an additional barrier to pressurize traders to lower levels.
If the coin shows sustainability below the pierced support, the sellers may drive the prices 7.5% down to hit the $25,000 psychological level. This support preventing BTC price from major correction for the last seven months indicates a high accumulation zone for investors.
[converter id=”btc-bitcoin” url=”https://coingape.com/price/converter/btc-to-usd/”]
Crypto Analyst Highlights Buying Opportunity
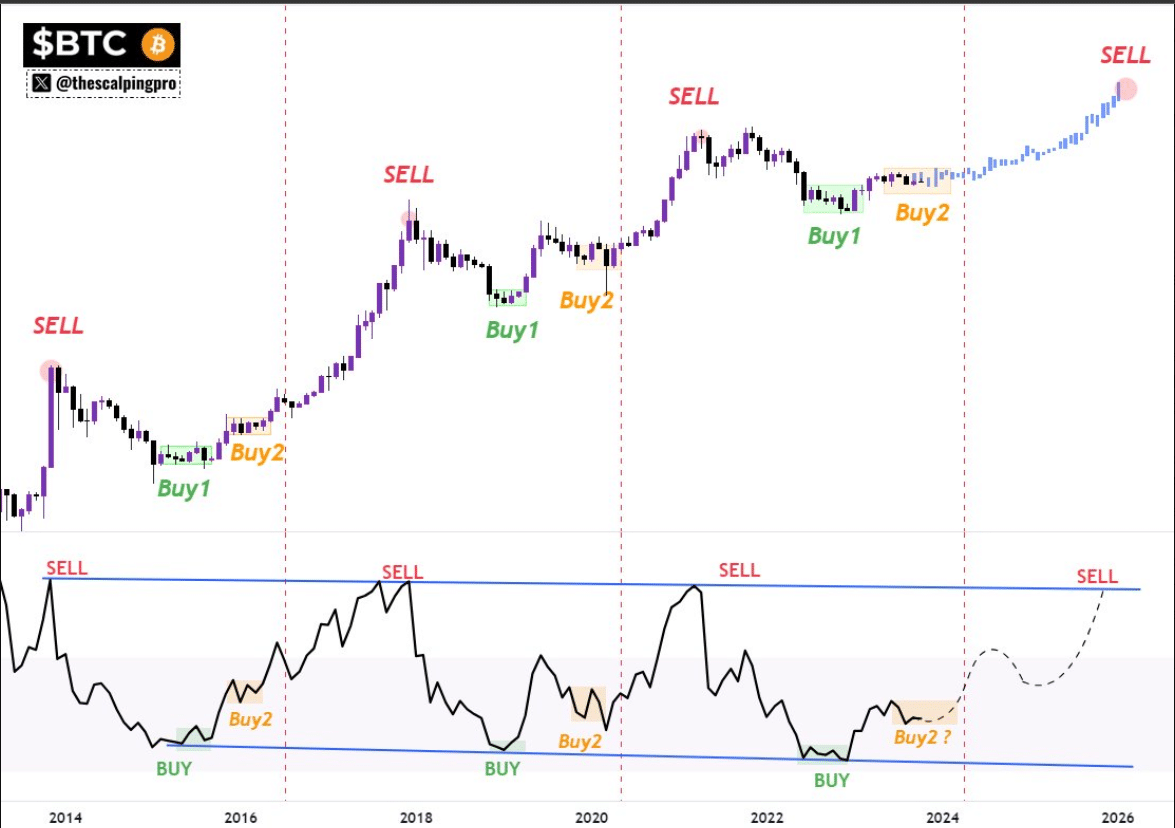
In a recent tweet from a renowned crypto analyst @thescalpingpro, the largest cryptocurrency Bitcoin provided two buying opportunities in response to the halving events. During the bear market, the first presents itself approximately 500 days before the Halving event, while the second comes around 180 days before this significant milestone.
What’s intriguing is that the price during the second dip has never fallen below that of the first buying opportunity. These opportunities, consistently occurring before the halving event, have proven to yield impressive returns
- Exponential Moving Average: The BTC price drop below daily EMAs(20, 50, 100, and 200) reflects bearish sentiment in the market.
- Vortex Indicator: A potential bearish crossover between the VI+(blue) and VI-(orange) slope would accelerate the supply pressure.


- December Recovery Ahead? Coinbase Outlines Why Crypto Market May Rebound
- Peter Brandt Hints at Further Downside for Bitcoin After Brief Rebound
- $1.3T BPCE To Roll Out Bitcoin, Ethereum and Solana Trading For Clients
- Why is the LUNC Price Up 70% Despite the Crypto Market’s Decline?
- CoinShares Fires Back at Arthur Hayes, Dismisses Fears Over Tether Solvency
- Ethereum Price Holds $3,000 as Bitmine Scoops Up $199M in ETH; What Next?
- Solana Price Outlook Strengthens as Spot ETFs See $15.68M in Fresh Inflows
- Dogecoin Price Gears Up for a $0.20 Breakout as Inverse H&S Takes Shape
- Bitcoin Price Forecast as BlackRock Sends $125M in BTC to Coinbase — Is a Crash Inevitable?
- XRP Price Prediction As Spot ETF Inflows Near $1 Billion: What’s Next?
- Solana Price Outlook: Reversal at Key Support Could Lead to $150 Target


Why Trust CoinGape
CoinGape has covered the cryptocurrency industry since 2017, aiming to provide informative insights Read more…to our readers. Our journal analysts bring years of experience in market analysis and blockchain technology to ensure factual accuracy and balanced reporting. By following our Editorial Policy, our writers verify every source, fact-check each story, rely on reputable sources, and attribute quotes and media correctly. We also follow a rigorous Review Methodology when evaluating exchanges and tools. From emerging blockchain projects and coin launches to industry events and technical developments, we cover all facets of the digital asset space with unwavering commitment to timely, relevant information.
24 Hours volume
$21.75B
Market Cap
$1.79T
Max Supply
21M
Premium Partners


