What’s Ahead for $PEPE Price After 25% Jump in a Week


Over the past fortnight, the pepe coin has largely traded in a sideways manner, oscillating between the $0.06 and $0.07 levels. However, with a positive sentiment shift in the broader crypto market, the coin buyers gave a decisive breakout from the upper boundary on September 27th. Anyhow, can this breakout catalyze a sustained rally for this meme coin?
Also Read: Memecoin Price Analysis: DOGE, PEPE, SHIB, BONE; Winners And Losers
Is the Current Recovery Sustainable?
- The crypto traders may face high selling pressure at $0.0000083
- A potential breakout from the resistance trendline will signal an early sign of trend reversal
- The 24-hour trading volume in the Pepe coin is $111.5 Million, indicating a 27% loss.
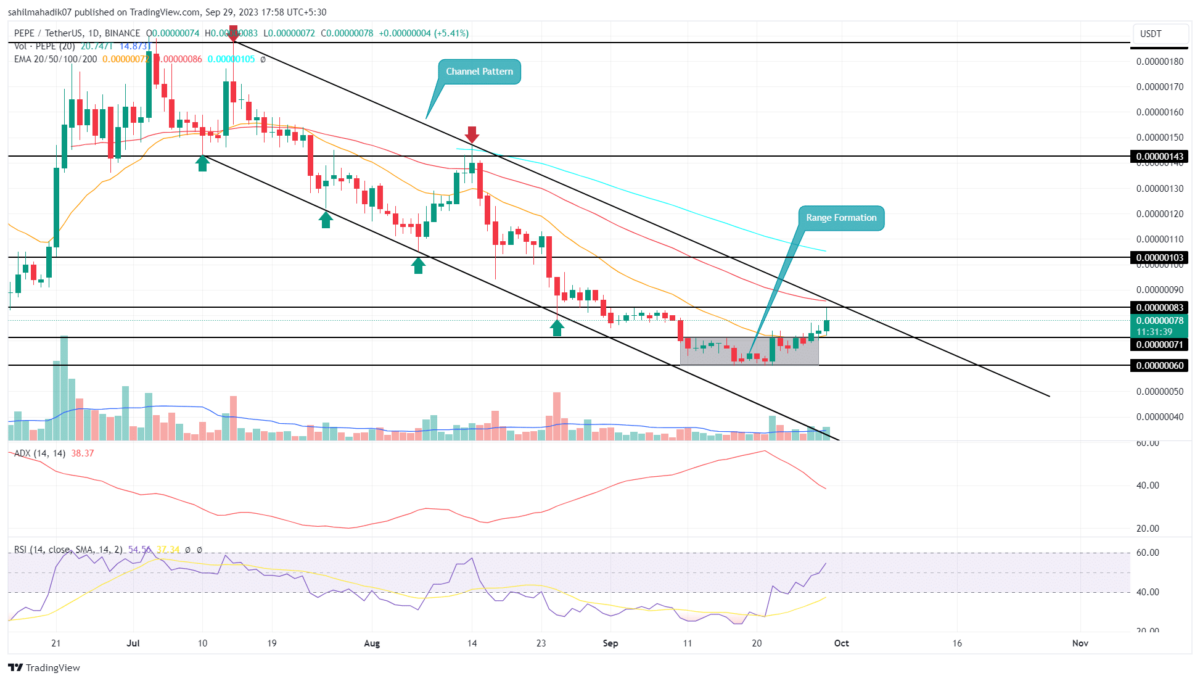
 Source: Tradingview
On September 22, the Pepe coin price saw a significant reversal from the psychological support level of $0.0000006. This price surge corresponds with a generally positive sentiment in the broader crypto market, marking a 35% gain within just one week.
At the time of writing, the coin is trading at $0.0000008, approaching a major resistance zone at $0.00000085. This resistance is further amplified by a downward-sloping trendline, which forms the upper boundary of a channel pattern.
The last two months’ correction can be marked by this channel pattern, where its upper trendline has acted as a dynamic resistance. A high wick rejection observed in today’s candle reflects the overhead supply pressure in action.
If an attempt to breach this trendline results in increased selling pressure, we could see Pepe coin entering a new correction, potentially revisiting its previous support level at $0.0000006 and may break beyond.
Will PEPE Price Break $0.000001?
If the overall market sentiment remains bullish, the Pepe coin could aim for a decisive breakout above the declining resistance trendline. A daily candlestick closure above this level would offer robust support for the coin price, possibly extending its recent rally. In such a bullish scenario, the coin price could soar by approximately 70%, targeting the $0.00000143 level.
- Exponential Moving Average: The 50-day EMA walking along the upper trendline may exert additional selling pressure on traders.
- Relative Strength Index: The daily RSI slope above 50% reflects a positive sentiment in the market.
- Average Directional Index: The falling ADX slope reflects the weakening bearish momentum.

Why Trust CoinGape
CoinGape has covered the cryptocurrency industry since 2017, aiming to provide informative insights Read more…to our readers. Our journal analysts bring years of experience in market analysis and blockchain technology to ensure factual accuracy and balanced reporting. By following our Editorial Policy, our writers verify every source, fact-check each story, rely on reputable sources, and attribute quotes and media correctly. We also follow a rigorous Review Methodology when evaluating exchanges and tools. From emerging blockchain projects and coin launches to industry events and technical developments, we cover all facets of the digital asset space with unwavering commitment to timely, relevant information.
Pepe
24 Hours volume
$315.51M
Market Cap
$1.59B
Max Supply
420.69T
Related Articles


- Will Bitcoin Crash Again as ‘Trump Insider’ Whale Dumps 6,599 BTC
- XRP News: Ripple’s RLUSD Gets Boost as CFTC Expands Approved Tokenized Collateral
- Crypto Markets Brace as Another Partial U.S. Government Shutdown Looms Next Week
- $40B Bitcoin Airdrop Error: Bithumb to Reimburse Customer Losses After BTC Crash To $55k
- ETH Price Fears Major Crash As Trend Research Deposits $1.8B Ethereum to Binance
- Cardano Price Prediction as Midnight Token Soars 15%
- Bitcoin and XRP Price Outlook Ahead of Crypto Market Bill Nearing Key Phase on Feb 10th
- Bitcoin Price Prediction as Funding Rate Tumbles Ahead of $2.1B Options Expiry
- Ethereum Price Outlook as Vitalik Buterin Sells $14 Million Worth of ETH: What’s Next for Ether?
- Solana Price at Risk of Crashing Below $50 as Crypto Fear and Greed Index Plunges to 5
- Pi Network Price Prediction Ahead of PI KYC Validator Reward System Launch


