What’s Next For Ethereum Price after a Breakdown Below $1900?
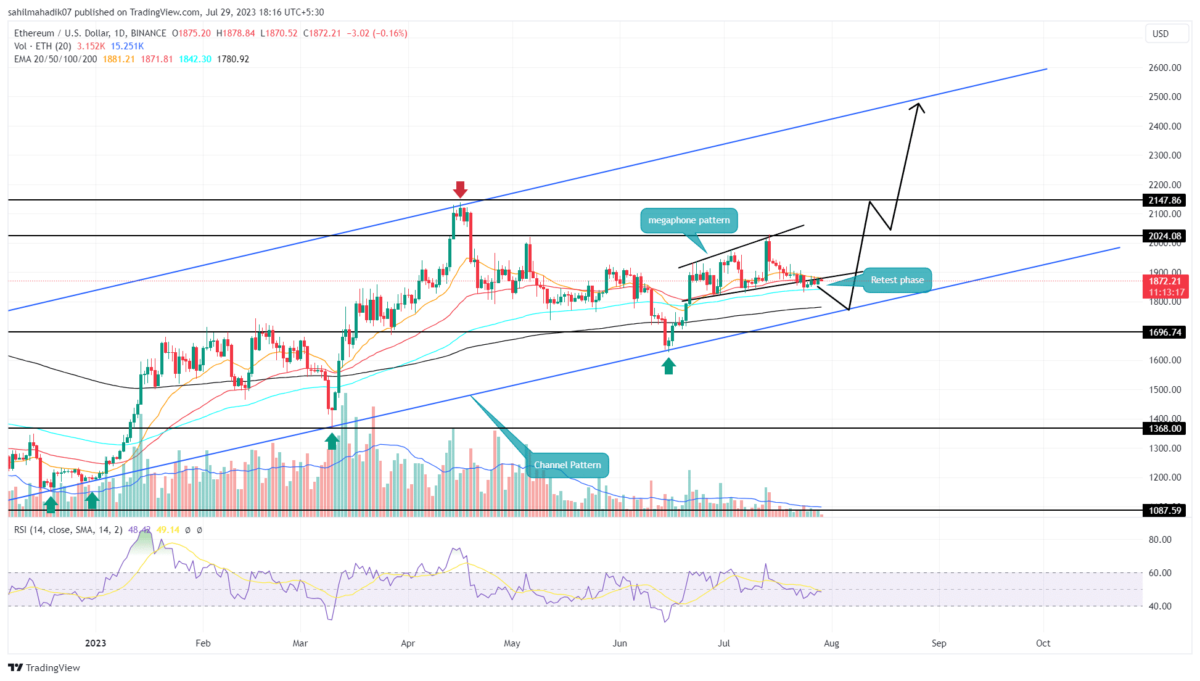
On July 24th, Ethereum price witnessed a significant outflow and breached the bottom support of the megaphone pattern. This bearish momentum accompanied by an uptick in trading volume suggests a strong likelihood of further price depreciation. However, with no follow-up to the breakdown candle, the downtrend momentum is under question, sparking a slight possibility of a bear trap.
Also Read: Ethereum Price Rally Awaits This Bullish Pattern Confirmation
Ethereum Price Daily Chart
- The 20-day EMA flipped into a dynamic resistance for Ethereum buyers
- A rising channel pattern is a carrier of the current bull run.
- The intraday trading volume in Ethereum is $31.6 Billion, indicating a 19% loss.
Over the past four days, Ethereum price movement with alternative green and red candles reflects uncertainty among market participants. With the price wavering below the recently breached support trendline at $1900, it seems that sellers are attempting to sustain below their newly gained resistance. At the time of writing, Ethereum, the second leading cryptocurrency, is being traded at $1872, a modest intraday gain of 0.13%.
The daily candles with higher price rejection indicate the supply momentum is building. If the pressure from sellers continues to mount, the ETH price could see a steep drop of 5%, potentially bringing the price down to the psychological support level of $1800.
However, the anticipated downfall could retest the support trendline of a rising channel pattern creating a high accumulation zone for potential buyers. If the coin buyers manage to hold this trendline, the replenished bullish momentum could set off a new recovery cycle.
[converter id=”eth-ethereum” url=”https://coingape.com/price/converter/eth-to-usd/?amount=1″]
Can ETH Price Claw its Way Back to $2000?
A high momentum breakdown below the significant support could lead to a rapid decline, reaching its targeted low without much delay. However, if the ETH price continues to fluctuate below the breached trendline, it could be a sign of waning bearish momentum. If buyers take advantage of this, the coin price will enter the megaphone. This possible breakout will validate the prior breakdown as a bear trap and bolster buyers for a rally above $200
- Exponential moving average: A potential breakdown below the 100-day EMA will signal the continuation of the correction phase
- Relative Strength Index: Despite the recent breakdown, the daily RSI slope still wavering near the 50% mark indicating weakness in bullish momentum
Recent Posts
- Price Analysis
Will Solana Price Hit $150 as Mangocueticals Partners With Cube Group on $100M SOL Treasury?
Solana price remains a focal point as it responds to both institutional alignment and shifting…
- Price Analysis
SUI Price Forecast After Bitwise Filed for SUI ETF With U.S. SEC – Is $3 Next?
SUI price remains positioned at a critical intersection of regulatory positioning and technical structure. Recent…
- Price Analysis
Bitcoin Price Alarming Pattern Points to a Dip to $80k as $2.7b Options Expires Today
Bitcoin price rebounded by 3% today, Dec. 19, reaching a high of $87,960. This rise…
- Price Analysis
Dogecoin Price Prediction Points to $0.20 Rebound as Coinbase Launches Regulated DOGE Futures
Dogecoin price has gone back to the spotlight as it responds to the growing derivatives…
- Price Analysis
Pi Coin Price Prediction as Expert Warns Bitcoin May Hit $70k After BoJ Rate Hike
Pi Coin price rose by 1.05% today, Dec. 18, mirroring the performance of Bitcoin and…
- Price Analysis
Cardano Price Outlook: Will the NIGHT Token Demand Surge Trigger a Rebound?
Cardano price has entered a decisive phase as NIGHT token liquidity rotation intersects with structural…