What’s Next for MATIC Price after 20% Rise in a Week?


The current recovery cycle in the crypto market is likely associated with the interest of big asset management companies in spot Bitcoin ETF. The MATIC coin price received a certain boast in its relief rally as the market leaders Bitcoin and Ethereum witnessed significant inflow. If the bullish momentum persists, the altcoin would rise another 12-15% before hitting the next significant resistance. Is this a good time to invest?
Also Read: Polygon Launches ChatGPT-Powered Guide to Web3.0
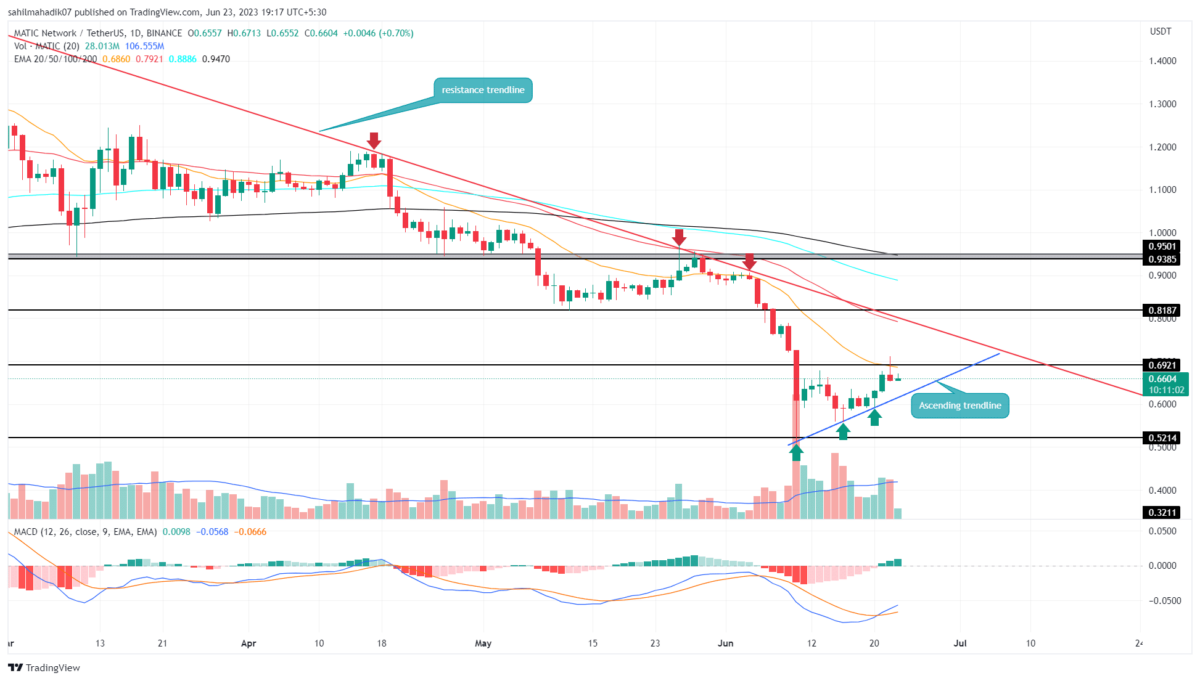
MATIC Price Daily Chart
- The MATIC price is poised for a minor pullback before resuming the bullish recovery
- An ascending trendline carries the current relief rally in this coin.
- The intraday trading volume in the MATIC is $278.5 Million, indicating a 41.5% loss.
 Source-Tradingview
For nearly two weeks, the MATIC price has been wobbling in a sideways trend struggling between the sentiment of an overall downtrend and accumulation pressure at the lower prices. However, as the bullish sentiment in the market rose, the buyers initiated a new relief rally with the assistance of a new ascending trendline(blue).
In the 4-hour time frame, the rising trendline offers dynamic support to buyers, bolstering the price to higher levels. Under the influence of the support trendline, the MATIC price showed 24% growth from last week’s swing low of $0.56 to reach the overhead resistance of $0.692.
By press time, the coin price traded at $0.667, with an intraday gain of 1.62%.
Furthermore, the recent failure of prices to break the $0.71 resistance could trigger a minor correction to retest the support trendline. This pullback could offer interested traders an opportunity to enter and capitalize on the current recovery cycle.
Will MATIC Price Kickstart A New Recovery Cycle?
A potential retest to the aforementioned trend could replenish the bullish momentum in polygon coins to resume the current recovery rally. With sustained buying, the coin price could rise 12-15% before meeting the long-coming resistance trendline(red). The overhead resistance is leading to a downtrend in this altcoin for the last fours, and therefore its breakout is important to get a better confirmation for trend reversal.
- Exponential Moving Average: The 20-day EMA as dynamic resistance is assisting sellers to pressurize the MATIC price at lower levels.
- Moving Average Convergence Divergence: A bullish crossover between the MACD(blue) and signal(orange) increasing buying pressure among traders.

Why Trust CoinGape
CoinGape has covered the cryptocurrency industry since 2017, aiming to provide informative insights Read more…to our readers. Our journal analysts bring years of experience in market analysis and blockchain technology to ensure factual accuracy and balanced reporting. By following our Editorial Policy, our writers verify every source, fact-check each story, rely on reputable sources, and attribute quotes and media correctly. We also follow a rigorous Review Methodology when evaluating exchanges and tools. From emerging blockchain projects and coin launches to industry events and technical developments, we cover all facets of the digital asset space with unwavering commitment to timely, relevant information.

Related Articles


- Solana Mobile’s SKR Token Launches Jan. 21: What to Know About the Seeker Airdrop
- Breaking: XRP Spot Trading Goes Live on Hyperliquid via Flare’s FXRP
- Bitcoin Falls Despite U.S. JOLTS Job Openings Missing Expectations
- JPMorgan To Expand JPM Coin to Canton Network After Launch on Coinbase’s Base
- Stablecoins Gain Infrastructure Boost as Morph Backs Startups with $150M
- XRP vs Solana Price: Which Could Outperform in January 2026?
- Meme Coin Price Prediction For Jan 2026: Dogecoin, Shiba Inu And Pepe Coin
- Pi Coin Price Eyes Rebound to $0.25 as Top Whale Nears 400M Milestone
- Ethereum Price Prediction Ahead of US data Report
- Bitcoin Price Prediction as FOMC Nears: Will 90% No-Cut Probability Pressure BTC?
- Dogecoin Price Outlook as Futures Open Interest Nears $2B: What Next for DOGE?


