Where May Bitcoin Price Head in June; $30k or $22k?
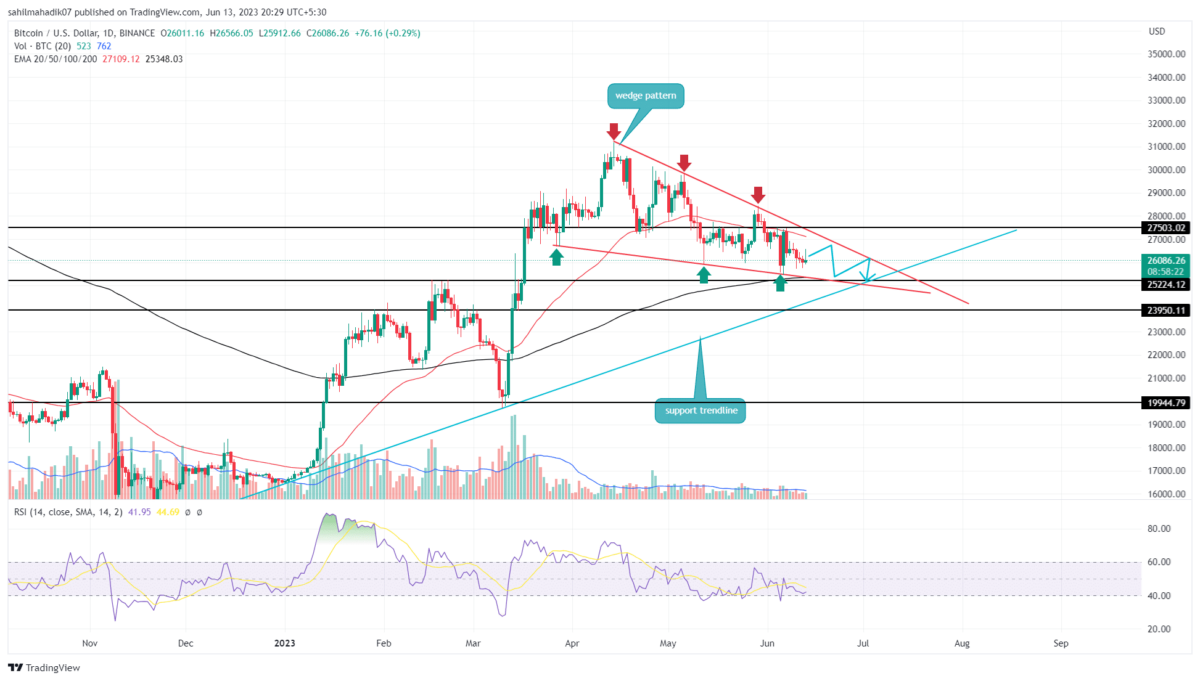
The largest cryptocurrency, Bitcoin, has impressively withstood the recent sell-off in the crypto market. While the majority of altcoins witnessed prolonged corrections, BTC remained sideways, holding crucial support levels. Despite highly volatile behavior, the coin’s price strictly adheres to the long coming wedge pattern, indicating a reliable chart setup for predicting the near-term future.
Also Read: Bitcoin Price At a Crossroads Despite Bear Market Stability – US SEC Triggers Altcoins Uncertainty
Bitcoin Price Daily Chart:
- The decreased volume throughout the two-month correction phase indicates that this downfall is temporary.
- Completing the wedge pattern will end the Bitcoin price’s current sideways trend.
- The intraday trading volume in Bitcoin is $12.2 billion, indicating a 22% loss.
Sideways Action and Breakout Opportunity:
Over the past six days, the Bitcoin price has showcased several short-bodied candles with long-rejection wicks on either side. These candles of uncertainty reflect no clear dominance from buyers or sellers, suggesting that coin holders could witness high volatility in the coming days.
While prices may continue the sideways action for a week or two, the wedge pattern’s trendlines are gradually converging, indicating that the narrow space will soon trigger a breakout opportunity. In theory, the wedge pattern is a continuation pattern, and therefore, the Bitcoin price is likely to break the overhead trendline.
The potential breakout will accelerate the bullish momentum and may offer entry opportunities to traders, with the post-breakout setting the BTC price to shoot above $30,000.
Will Bitcoin Price Hit $20,000?
The support trendline of the wedge pattern has prevented the Bitcoin price from experiencing excessive downfall despite increased bearishness in the crypto market. Therefore, the coin uses this level as a key support to maintain a bullish outlook. Until that trendline is intact, the Bitcoin price is less likely to go below $25,000.
- Relative Strength Index: The daily RSI slope wavering below the midline (50) gives a slight negative momentum in price.
- Exponential Moving Average: The 50-day and 200-day EMAs aligned with the converging trendline give additional confirmation of a narrow range, with a breakout triggering a directional rally.
Recent Posts
- Price Analysis
Ethereum Price Prediction 2026 As Vitalik Buterin Unveils New Scaling Roadmap
Ethereum price as the year 2026 begins has rallied past $3,100, marking a strong recovery.…
- Price Analysis
Bitcoin Price and XRP Price Prediction 2026 Ahead of US Crypto Reserve, CLARITY Act
Bitcoin price and XRP price enter 2026 trading within compression structures that reflect balance rather…
- Price Analysis
Analyst Predicts Cardano Price to Surge 103% to $0.75 as Midnight, Leios Launch Near
Cardano price started the year well, rising for the initial two days. ADA rose by…
- Price Analysis
Dogecoin Price Jumps 10% as Whales Scoop Up 220M DOGE; What’s Next?
Dogecoin price soared 10% within the last 24 hours as whale wallets accumulated more than…
- Price Analysis
Here’s Why Crypto Market Turns Bullish as 2026 Kicks Off
The crypto market began 2026 with bullish momentum after weeks of cautious trading in late…
- Price Analysis
Pepe Coin price Enters 2026 with a 25% Surge as Open Interest Jumps 82% — What’s Next?
PEPE Coin price enters the new year with visible strength after surging over 25%, as…