Will Bitcoin Price Renews Lows Below $18,000?


Bitcoin price is currently trading in a lower trading zone. The selling accelerated as the price breached below $19,000 for the first time since June. As long the price stayed below the mentioned level the more chances of starting a new downward cycle.
- Bitcoin price trades with a negative bias on Wednesday.
- The price dropped below the critical 200-day exponential moving average.
- More downside risk if closes below $18,000 on the daily basis.
Bitcoin price breaks the consolidation to the lower level
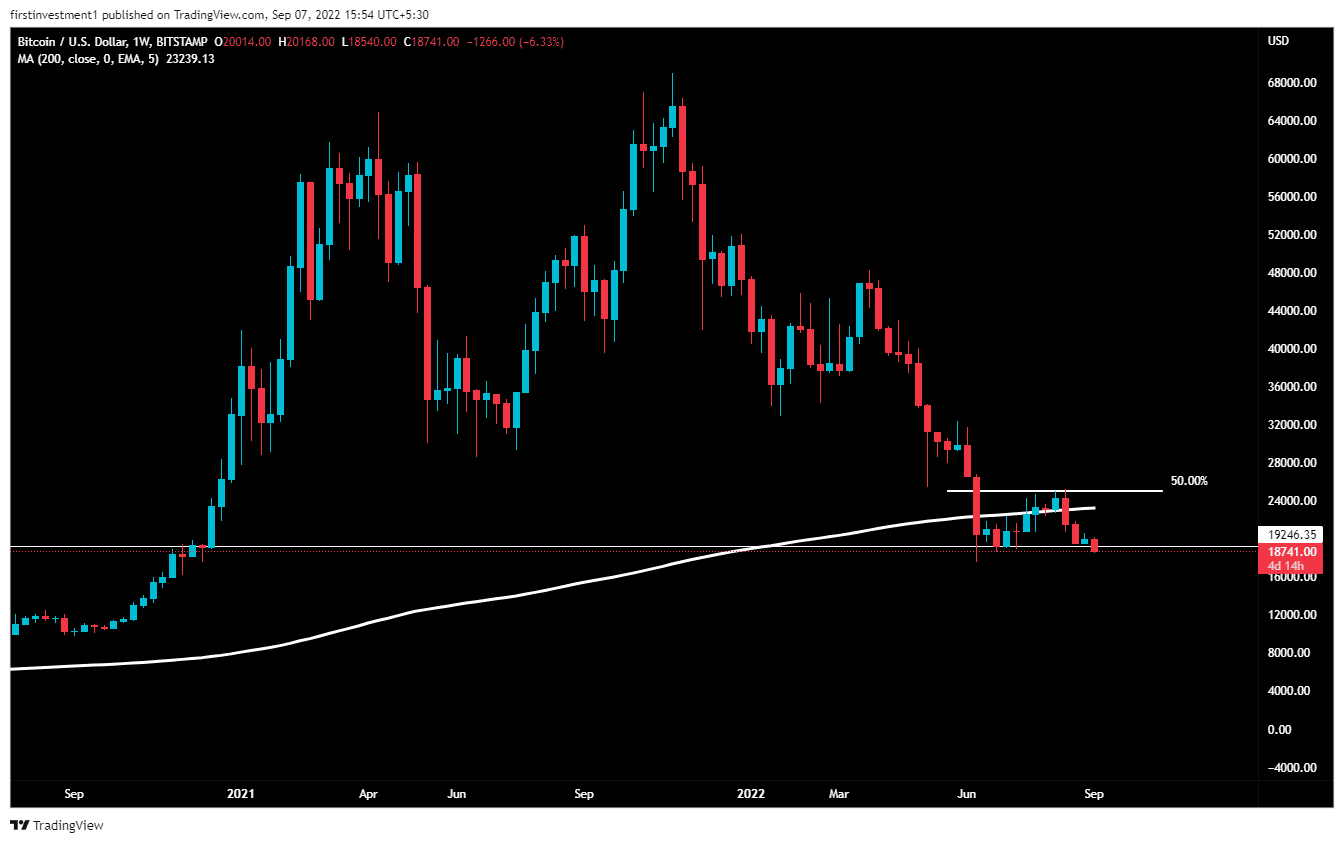
BTC on the weekly chart is trending lower breaking every crucial support level. The price test is the 50% Fibonacci retracement level of the downward move from the $32,285 swing high to the $17,770 low.
Further, the downside pressure is added as the Bitcoin price is sliced below the 200-day exponential moving average. According to this chart, if the price on the weekly chart closes below $19,250, then we can expect a sharp fall of up to $17,675.

Bitcoin price on the daily chart gave a breakout of a bearish “Flag & Pole” Pattern. The bearish flag is a candlestick chart pattern that signals the extension of the downtrend once the temporary pause is finished. As a continuation pattern, the bear flag helps sellers to push the price action further lower. With falling price along with Rising volumes indicates that more big money players are entering this fall.
According to this structure, BTC may take some pullback before going down further. The nearest resistance, this price may face is around $19,250. Now, a retest of the mentioned level would mean some kind of rejection near the higher levels, the “Sell on rising” opportunity should be in play at that time.
With the expected downfall, the BTC price can go up to the lows of June 18 ($17,675).
The nearest support is ($18,600), whereas the nearest resistance is around ($19,250). There is a higher probability of the price breaking its support But, if any chance price tends to come close to its resistance, and we’ve seen any rejection there with rising volumes, then we can sell there as per the strategy of selling at high to capitalize the gains.
On the other hand, a break above the $20,000 level could invalidate the bearish outlook. And the price can test $21,650
BTC is bearish on all time frames. Below $18,600 closing on the hourly time frame, we can put a trade on the sell side.
As of press time, BTC/USD is reading at $18,711, down 0.21% for the day.

Why Trust CoinGape
CoinGape has covered the cryptocurrency industry since 2017, aiming to provide informative insights Read more…to our readers. Our journal analysts bring years of experience in market analysis and blockchain technology to ensure factual accuracy and balanced reporting. By following our Editorial Policy, our writers verify every source, fact-check each story, rely on reputable sources, and attribute quotes and media correctly. We also follow a rigorous Review Methodology when evaluating exchanges and tools. From emerging blockchain projects and coin launches to industry events and technical developments, we cover all facets of the digital asset space with unwavering commitment to timely, relevant information.

Related Articles


- Peter Thiel Exits ETHZilla as Stock Slides 3% Amid Token Launch
- Bitwise, Granitshares Eyes $63B Sector With New Prediction Markets ETF Filing
- Breaking: Grayscale Sui Staking ETF to Start Trading on NYSE Arca Today
- Prediction Market Lawsuit: Nevada Targets Kalshi in Court After Action Against Polymarket
- Robinhood to Raise $1B IPO to Open Private Markets to Retail Investors
- How Long Will Pi Network Price Rally Continue?
- Pi Network Price Beats Bitcoin, Ethereum, XRP as Upgrades and Potential CEX Listing Fuels Demand
- 5 Things Dogecoin Price Needs to Hit $0.20 in Feb 2026
- Bitcoin Price Prediction as Experts Warns of Quantum Risks
- Dogecoin, Shiba Inu, Pepe Coin Price Predictions As BTC Crashes Below $68k
- Ethereum Price Outlook as Harvard Shifts Focus from Bitcoin to ETH ETF


