Will $BNB Price Head to $200 Amid Market Sell-off?
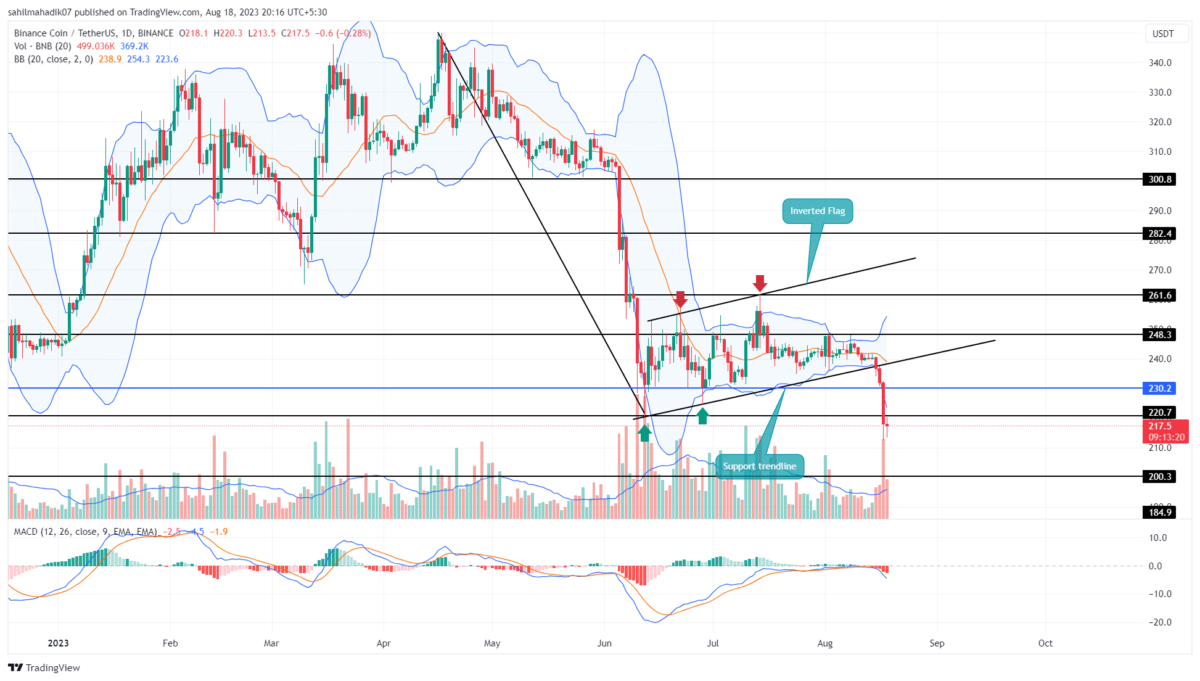
For over two months, the Binance coin price witnessed a slightly inclined trend as it resonated between the two trendlines of an inverted flag pattern. Amid the July-August correction in the crypto market, the sellers breached the pattern’s support trendline on August 15th. This breakdown signaled the continuation of the prevailing downtrend and plunged to a price below $220 support. Should you sell on this?
Also Read: Binance Loses Contract With UK’s Checkout.com
BNB Price Daily Chart: Key Points
- Completion of inverted flag pattern hints prolong correction in BNB Price
- A breakdown below $220 support triggers an 8% drop
- The intraday trading volume in the BNB coin is $888.4 Million, indicating an 80% gain
The cryptocurrency market experienced a notable bloodbath on August 17th, as the leading digital currency, Bitcoin, faced aggressive selling. This was likely instigated by SpaceX’s decision to divest its holdings in Bitcoin, creating a ripple effect of increased selling pressure throughout the crypto space. Consequently, Binance coin, the fourth largest cryptocurrency, saw a substantial outflow of funds and recorded a 5.99% intraday loss.
This drop has a high momentum breakdown below $220 support indicating the sellers obtained another resistance to pressurize buyers. By the press time, the BNB price trades at $218, with an intraday loss of 0.05%.
If the coin price shows sustainability below $220, the price will likely tumble another 8% to hit the $200 psychological level.
Can Binance Coin Make a Recovery Back to 230?
In the daily time frame chart, the BNB price shows two candles with lower price rejection near the $212 level. This demand pressure from below could trigger a minor pullback to test the breached support of $220. This retest will check price sustainability for interested short-sellers and offer new entry opportunities for them. However, in case the coin price breaks above $220, the anticipated pullback could reach $230.
- Bollinger Band: The coin price challenging the lower band Bollinger Band indicator reflects high momentum selling in the market.
- Moving Average Convergence Divergence: A negative crossover between the MACD+(blue) and Signal-(orange) slope signals a sustainable downtrend
Recent Posts
- Price Analysis
Shiba Inu Price Eyes a 45% Rebound as Burn Rate Spikes 10,700%
Shiba Inu price continued its freefall and is now hovering at its lowest level since…
- Price Analysis
Expert Predicts Ethereum Price Rebound to $4k as BitMine, Long-Term Holders Buy
Ethereum price rose by 1.5% today and moved slightly above the important resistance level at…
- Price Analysis
Bitcoin Price Prediction Ahead of FOMC Minutes
Bitcoin price continues trading within a tightening range, with BTC price holding between $88,000 and…
- Price Analysis
U.S. Government Shutdown Looms: These 3 Crypto Predictions Could Explode
As the January trading session unfolds, the crypto market rose 1.07% in 24 hours, showing…
- Price Analysis
Grayscale Files for First U.S. Bittensor ETF: Will TAO Price Rally to $300 in January?
Bittensor (TAO) price climbed above $220 in the last 24 hours after Grayscale filed for…
- Price Analysis
Shiba Inu Price Prediction: Will SHIB Show Golden Cross Signal in 2026?
Discussion around a potential Golden Cross in 2026 has intensified as Shina Inu price compresses…