Will BTC Price Regain $28000 Before August End?
After the massive dump on August 17th, the largest cryptocurrency Bitcoin has witnessed high volatility for nearly two weeks. While the downward projection continues, the daily candle shows a long-wick rejection on either side, reflecting uncertainty in bearish momentum. Will this indecisiveness lead to a bullish pullback or it’s a small breather for prolonged correction?
Also Read: Pro-Bitcoin DeSantis Rises As Champion After GOP Debate; Trump Still Leads
Bitcoin Daily Chart: Key Points
- A bullish breakout from the chart pattern will set an 8% price jump
- The Bitcoin fear and greed index at 38% reflects bearish sentiment among market participants
- The intraday trading volume in Bitcoin is $6.2 Billion, indicating a 30% loss.
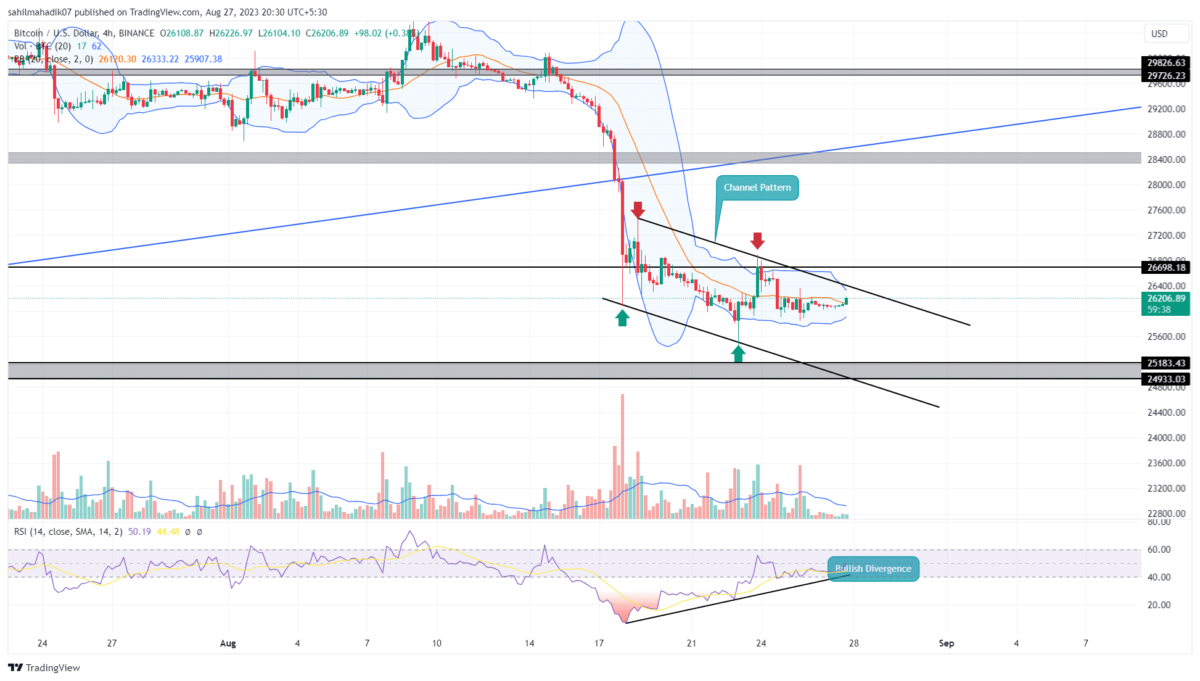
The 4-hour time frame chart shows the ongoing downtrend in a more stable manner wobbling between two parallel walking trendlines. This price behavior reflects the formation of a known bullish reversal pattern called the falling parallel channel.
By the press time, the Bitcoin price traded at $26166 with an intraday gain of 0.32%. This uptick will lead the coin price back to the overhead trendline with a potential bullish breakout. Anyhow, after a massive downfall, the asset price tends to show a minor pullback in order to stabilize the prevailing downtrend.
A 4-hour candle closing above the upper trendline will kickstart this anticipated bullish pullback. The post-breakout rally will push the prices 8% higher and retest the $28500 barrier.
The crypto holders must be cautious at this barrier as with the overall trend still negative, the sellers could recuperate bearish momentum for prolonged correction.
[converter id=”btc-bitcoin” url=”https://coingape.com/price/converter/btc-to-usd/”]
Will BTC Price Fall Back to $25000?
While the possibility of a bullish reversal seems valid, the two trendlines are currently leading to the ongoing downfall. Until the two trend lines are intact, the BTC price may extend the downward march. A potential reversal from this upper trendline will trigger a new bear cycle within the channel and lead the prices back to $25000.
- Bollinger Band: The narrowing range on the Bollinger Band indicator shows high volatility in the market.
- Relative Strength Index: Contrary to the falling price, the RSI slope shows an evident rise reflecting growing bullish momentum.
Recent Posts
- Price Analysis
Shiba Inu Price Prediction: Will SHIB Show Golden Cross Signal in 2026?
Discussion around a potential Golden Cross in 2026 has intensified as Shina Inu price compresses…
- Price Analysis
Pi Network Price Prediction as Demand Slips Ahead of the 136m Unlock
Pi Network price is stuck in a bear market this month, and odds are high…
- Price Analysis
Why Bitcoin, Ethereum, XRP, and ADA Prices Are Falling Today
Over the past 24 hours, Bitcoin, Ethereum, XRP, and ADA prices dropped as the broader…
- Price Analysis
Is XRP Price Preparing for Trend Reversal as ETF Inflows Extend to a 7th Straight Week?
The XRP price is in a consolidation stage following months of continuous declining pressure. The…
- Price Analysis
Binance Coin Price Risks Crash to $700 as Key BSC Metric Plunges 80%
Binance Coin price dropped by over 1% today, Dec. 29, as the crypto market remained…
- Price Analysis
SUI Price Forecast: What’s Next for SUI in 2026 After $78.9M Token Unlocks?
SUI price has spent recent sessions consolidating within a narrow range. The action reflect controlled…