

Will Cardano Price Below $0.3 Support lead to Extended Correction?


In response to the increasing bearishness of the crypto market, the Cardano price entered a correction phase after reverting from the $0.3793 mark. In the past three weeks, the memecoin tumbled 22.75% and reached the current trading price of $0.293. However, this pullback has started hinting at signs of major correction as the coin price entered the last swing resistance of $.03. Should you sell this?
Also Read: Cardano Price to $0.25? Monthly Support Breakdown Signals Major Correction
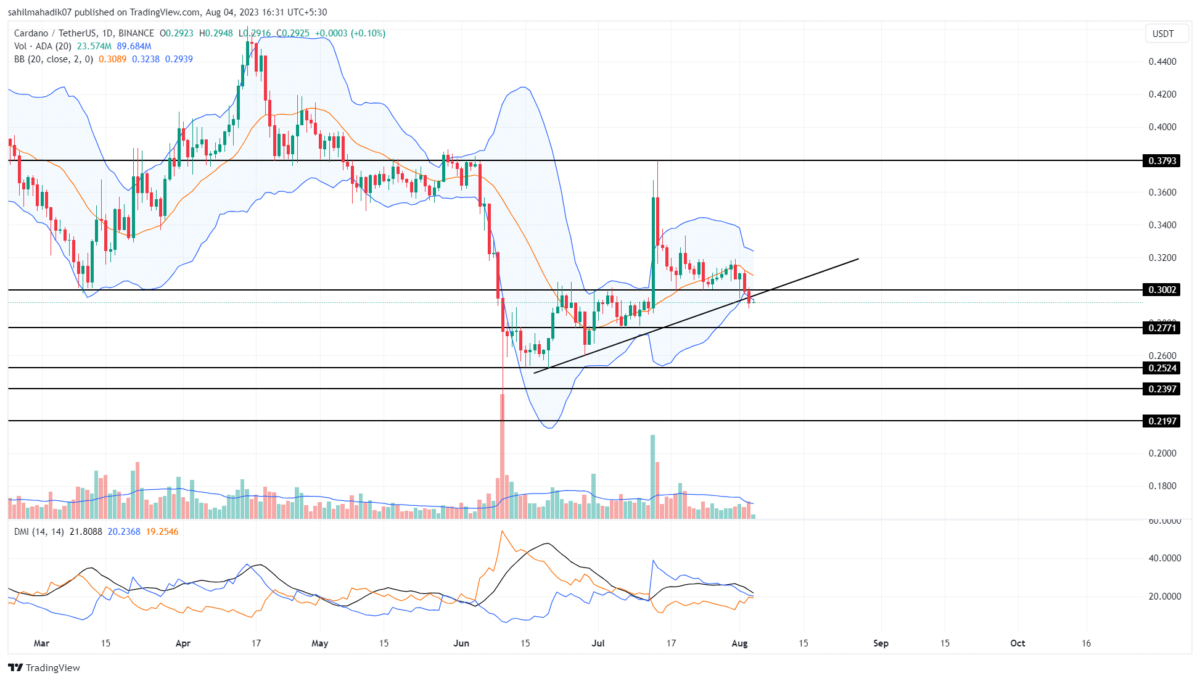
Cardano Price Daily Chart
- A breakdown below the support trendline sets the ADA price for a 5% drop
- The falling ADX slope reflects a decreasing selling pressure
- The intraday trading volume in the ADA coin is $278.2 Million, indicating a 2.3% gain.
 Source- Tradingview
Amid the ongoing correction, the falling Cardano price breached below two crucial support of $0.3 and a rising trendline. The trendline offered dynamic support to coin prices for the past six, and its breakdown signaled an early sign of major correction.
The August 3rd breakdown from the support trendline with high volume indicates sellers’ conviction to lead the price lower. By press time, the ADA price trades at $0.293 with an uptick of 0.24%.
This daily candle could check price sustainability after the breakdown and offer an opportunity to short-sell. If the bearish momentum persists, the Cardano price could witness a quick 5% drop to $0.277, followed by $0.254.
[converter id=”ada-cardano” url=”https://coingape.com/price/converter/cardano-to-usd/?amount=1″]
ADA Price to Cancel out June-July Recovery?
As per the Fibonacci retracement level, the Cardano price breakdown below $0.3 support also breached the 61.8% FIB level. In technical analysis, a correction below the 50% retracement level starts reflecting weakness in bearish momentum. The anticipated downfall is more likely to evaporate the June-July rally and fall to $0.252.
- Bollinger Band: The downtick in the lower band of the Bollinger Band indicator reflects high momentum selling in the market.
- Direction Moving Average: The DI+(blue) and DI-(orange) slope near a bearish crossover could attract more sellers in the market.

Why Trust CoinGape
CoinGape has covered the cryptocurrency industry since 2017, aiming to provide informative insights Read more…to our readers. Our journal analysts bring years of experience in market analysis and blockchain technology to ensure factual accuracy and balanced reporting. By following our Editorial Policy, our writers verify every source, fact-check each story, rely on reputable sources, and attribute quotes and media correctly. We also follow a rigorous Review Methodology when evaluating exchanges and tools. From emerging blockchain projects and coin launches to industry events and technical developments, we cover all facets of the digital asset space with unwavering commitment to timely, relevant information.
Premium Partners


Related Articles


- Michael Saylor’s “Green Dots” Message Hints At Fresh Bitcoin Buying As BTC Faces $90K Wall
- Fed’s Hammack Signals No Rush to Cut Rates as January Hold Odds Near 80%
- XRP ETFs Reach $1.21B as Asset Managers See a ‘Third Path’ Beyond Bitcoin
- Nearly $50M in USDT Stolen After Address Poisoning Scam Targets Crypto Trader Wallet
- Breaking: Rep. Max Miller Unveils Crypto Tax Bill, Includes De Minimis Rules for Stablecoins
- Will Solana Price Hit $150 as Mangocueticals Partners With Cube Group on $100M SOL Treasury?
- SUI Price Forecast After Bitwise Filed for SUI ETF With U.S. SEC – Is $3 Next?
- Bitcoin Price Alarming Pattern Points to a Dip to $80k as $2.7b Options Expires Today
- Dogecoin Price Prediction Points to $0.20 Rebound as Coinbase Launches Regulated DOGE Futures
- Pi Coin Price Prediction as Expert Warns Bitcoin May Hit $70k After BoJ Rate Hike
- Cardano Price Outlook: Will the NIGHT Token Demand Surge Trigger a Rebound?


