Will Cardano Price Below $0.3 Support lead to Extended Correction?
In response to the increasing bearishness of the crypto market, the Cardano price entered a correction phase after reverting from the $0.3793 mark. In the past three weeks, the memecoin tumbled 22.75% and reached the current trading price of $0.293. However, this pullback has started hinting at signs of major correction as the coin price entered the last swing resistance of $.03. Should you sell this?
Also Read: Cardano Price to $0.25? Monthly Support Breakdown Signals Major Correction
Cardano Price Daily Chart
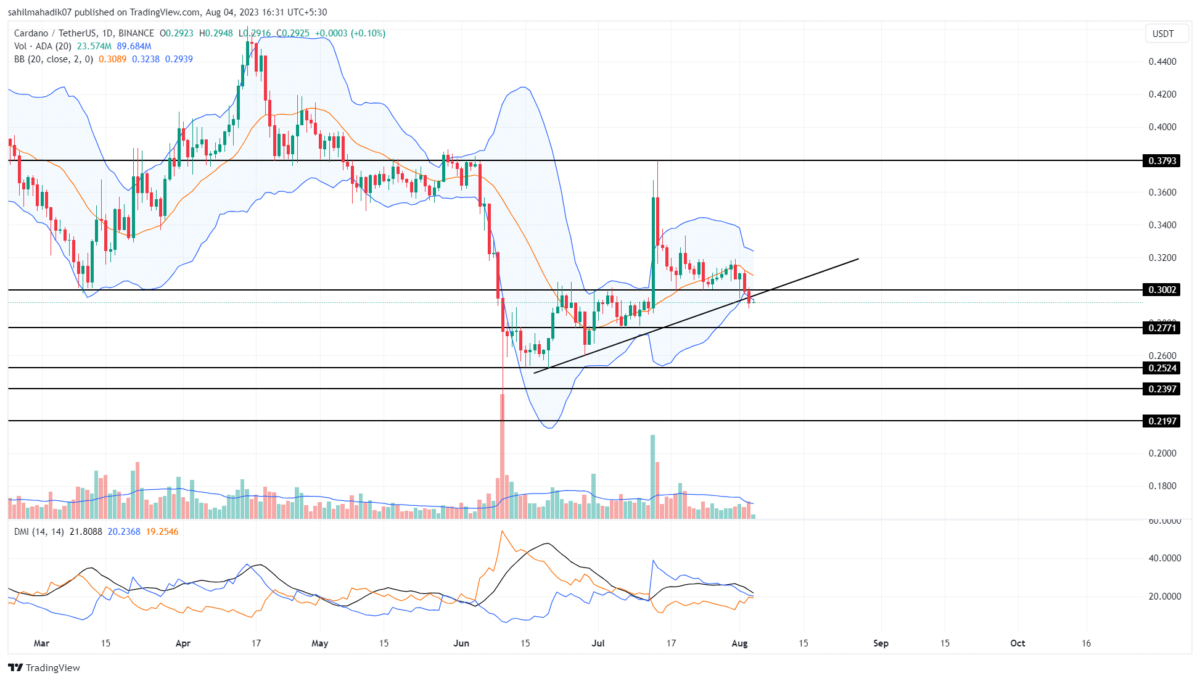
- A breakdown below the support trendline sets the ADA price for a 5% drop
- The falling ADX slope reflects a decreasing selling pressure
- The intraday trading volume in the ADA coin is $278.2 Million, indicating a 2.3% gain.
Amid the ongoing correction, the falling Cardano price breached below two crucial support of $0.3 and a rising trendline. The trendline offered dynamic support to coin prices for the past six, and its breakdown signaled an early sign of major correction.
The August 3rd breakdown from the support trendline with high volume indicates sellers’ conviction to lead the price lower. By press time, the ADA price trades at $0.293 with an uptick of 0.24%.
This daily candle could check price sustainability after the breakdown and offer an opportunity to short-sell. If the bearish momentum persists, the Cardano price could witness a quick 5% drop to $0.277, followed by $0.254.
[converter id=”ada-cardano” url=”https://coingape.com/price/converter/cardano-to-usd/?amount=1″]
ADA Price to Cancel out June-July Recovery?
As per the Fibonacci retracement level, the Cardano price breakdown below $0.3 support also breached the 61.8% FIB level. In technical analysis, a correction below the 50% retracement level starts reflecting weakness in bearish momentum. The anticipated downfall is more likely to evaporate the June-July rally and fall to $0.252.
- Bollinger Band: The downtick in the lower band of the Bollinger Band indicator reflects high momentum selling in the market.
- Direction Moving Average: The DI+(blue) and DI-(orange) slope near a bearish crossover could attract more sellers in the market.
Recent Posts
- Price Analysis
Will Solana Price Hit $150 as Mangocueticals Partners With Cube Group on $100M SOL Treasury?
Solana price remains a focal point as it responds to both institutional alignment and shifting…
- Price Analysis
SUI Price Forecast After Bitwise Filed for SUI ETF With U.S. SEC – Is $3 Next?
SUI price remains positioned at a critical intersection of regulatory positioning and technical structure. Recent…
- Price Analysis
Bitcoin Price Alarming Pattern Points to a Dip to $80k as $2.7b Options Expires Today
Bitcoin price rebounded by 3% today, Dec. 19, reaching a high of $87,960. This rise…
- Price Analysis
Dogecoin Price Prediction Points to $0.20 Rebound as Coinbase Launches Regulated DOGE Futures
Dogecoin price has gone back to the spotlight as it responds to the growing derivatives…
- Price Analysis
Pi Coin Price Prediction as Expert Warns Bitcoin May Hit $70k After BoJ Rate Hike
Pi Coin price rose by 1.05% today, Dec. 18, mirroring the performance of Bitcoin and…
- Price Analysis
Cardano Price Outlook: Will the NIGHT Token Demand Surge Trigger a Rebound?
Cardano price has entered a decisive phase as NIGHT token liquidity rotation intersects with structural…