Will Coinbase Stock Price Reclaim $100 Mark in August?
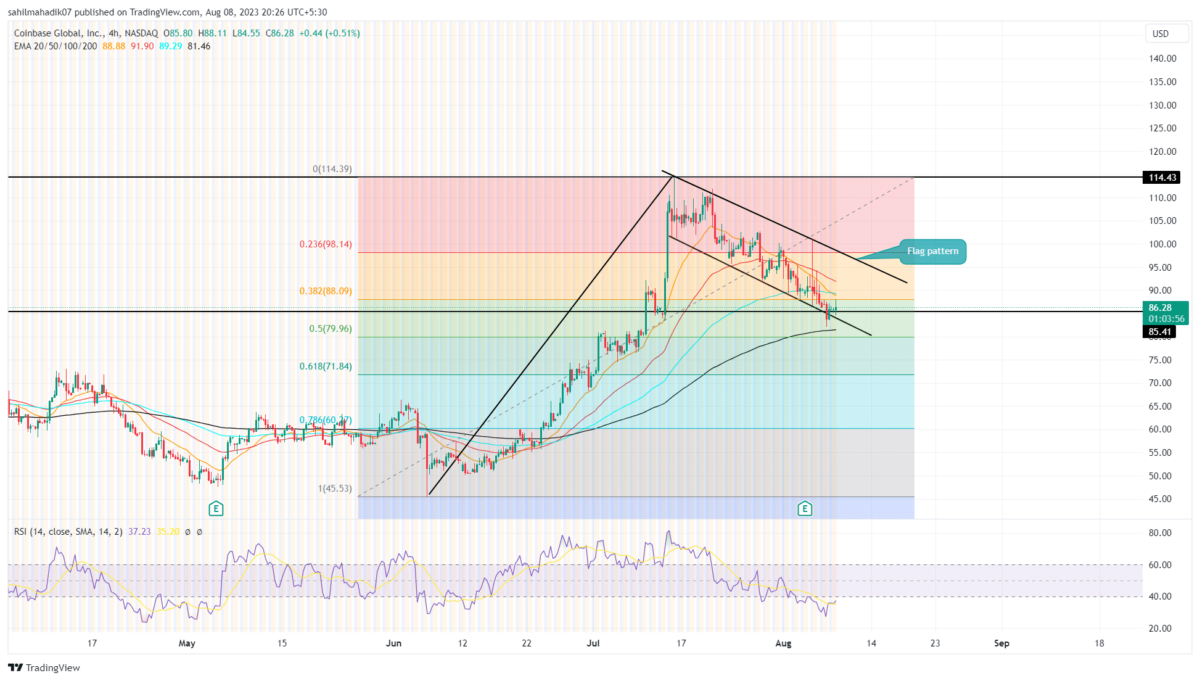
For nearly a month, the Coinbase stock price has been in a steady correction, wobbling between the two trendlines of the falling channel. The daily time frame shows the pullback is part of a higher chart pattern called ‘flag’, providing buyers a short breather before the next leap. From the last upswing of $114.1, the asset price tumbled 23.5% to reach the current price of $87.8. Here’s how this retracement could be an opportunity for traders to accumulate at discounted prices.
Also Read: Coinbase ($COIN) Losing Market Share Amid Bitcoin ETF Filings, Bad News For Crypto?
Coinbase Price Daily Chart
- A bullish breakout from the flag pattern could set the COIN price for a 20% upswing
- The stock price moving above the 200-day EMA reflects the overall trend is bullish
- A potential golden crossover between the 50-and-200-day EMAs could bolster the buying pressure
The bullish flag pattern is characterized by a significant rally followed by a minor correction meant to replenish buying momentum for the next leap. The correction part usually resonates between two parallel falling trendlines, and the breakout from the upper resistance signals the continuation of the bullish trend.
On August 7th, the COIN price broke down the pattern’s lower trendline, threatening holders for possibility for extended correction. However, the buyers stepped in immediately and pushed the price back into the channel.
These bear trap scenarios indicate the aggressive nature of buyers and high possibility of bullish reversal. With sustained buying, the coin base share price could rise 8-10% and challenge the upper trendline of the pattern.
Will Coinbase Stock Price Reach $114?
By the press time, the COIN price trades at $87.2 with an intraday gain of 1.58%. Under the influence of the flag pattern, the buyers are poised to breach the overhead resistance of the flag pattern. This breakout would signal the end of correction and start of a fresh rally. The post-breakout recovery could push the prices above the $100 and hit the $114 ceiling,
- Fibonacci retracement level: The ongoing correction still above the 50% FIB level indicate this retracement phase is healthy for long bull trend.
- Relative Strength Index: The daily RSI slope above 40% reflects the restoring bullish momentum.
Recent Posts
- Price Analysis
XRP, Bitcoin, Ethereum Price Predictions Ahead of Jan 2026 CLARITY Act and US Crypto Reserve Plans
The XRP, Bitcoin, and Ethereum prices remained in a bear market after falling by over…
- Price Analysis
Pi Network Analysis: Pi Coin Price Surges on Christmas Eve, Can It Hit Year-End Highs?
Pi coin price reflect cautious positioning as market structure tightens near a key base. The…
- Price Analysis
Why Dec 26th Is A Do Or Die for Bitcoin Price Ahead Of Record Options Expiry?
As Christmas winds down, the Bitcoin price dipped 0.74% to around $86,750. Market participants…
- Price Analysis
Why Bitcoin, Ethereum And XRP Prices Are Down Today? (24 Dec)
The crypto market extended losses ahead of Christmas as Bitcoin, Ethereum, and XRP slipped further…
- Price Analysis
XRP Price Prediction: Will 4 Billion Transactions Spark Next Rally?
XRP price trades below the $2 mark after the latest correction across the broader cryptocurrency…
- Price Analysis
Solana Price Outlook: Will SOL Recover With Strong Institutional Buying?
Solana price remains steady above the $120 support after the recent crypto market pullback. The…