Will Ethereum Price Lose $1800 Support Amidst Uncertain Markets?
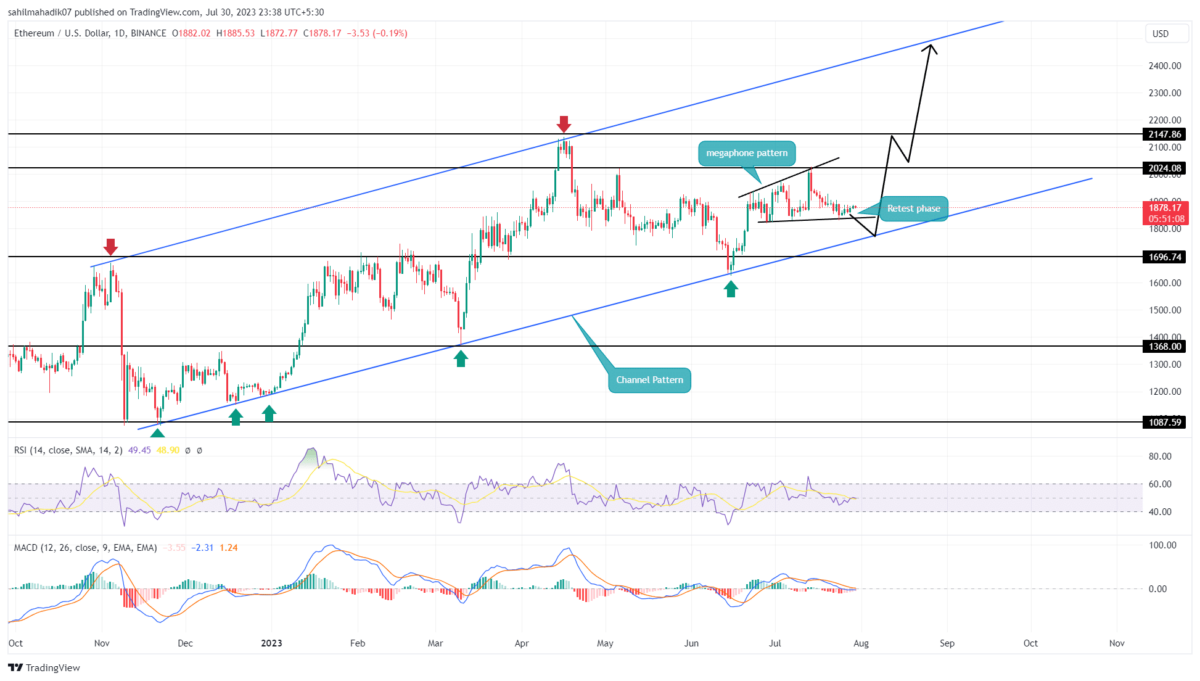
The Ethereum price maintains a sideways trend below the support trendline of a megaphone pattern. Teasing a potential reversal, the altcoin price prepares an upcycle within the price pattern forming in the daily chart. So, with crypto buyers ready for a hike, should you consider buying ETH this August?
Also Read: Ethereum Price Rally Awaits This Bullish Pattern Confirmation
Ethereum Price Daily Chart
- The short-bodied candles in the daily chart reflect uncertainty among market participants
- A potential reversal from the support trendline sets the ETH price for a 10% upswing.
- The intraday trading volume in Ethereum is $29.5 Billion, indicating a 25% loss.
Struggling to reclaim the uptrend momentum, ETH prices tend sideways close to a support trend line. Despite a bull pushing the lower trend, the buyers’ failure to rise higher indicates weakness in bullish momentum. Maintaining a higher high formation, the ETH price action hints at a modified megaphone pattern.
Moreover, in the larger picture, ETH price action maintains an uptrend in a rising channel. Therefore, the break down of the megaphone pattern can lead to another price fall to the bottom of the rising channel.
The lower support trendline carrying a bullish trend offers an opportunity to accumulate ETH at a discounted price.
[converter id=”eth-ethereum” url=”https://coingape.com/price/converter/eth-to-usd/?amount=1″]
What if ETH Price Breaks Support Trendline?
A high momentum bullish reversal from the support trendline could lead to a sharp recovery in Ethereum price, potentially crossing the $2000 barrier. However, if ETH continues to fluctuate under the $1900 mark, a bearish breakdown can drop the ETH price low to $1800.
- Moving Average Convergence Divergence: The MACD indicator displays a Bullish crossover in action projecting a potential Bullish bounce in ETH price.
- Relative Strength Index: The RSI indicator shows a sideways trend close to the halfway line reflecting a brawl between bulls and bears.
Recent Posts
- Price Analysis
XRP Price Prediction: Will 4 Billion Transactions Spark Next Rally?
XRP price trades below the $2 mark after the latest correction across the broader cryptocurrency…
- Price Analysis
Solana Price Outlook: Will SOL Recover With Strong Institutional Buying?
Solana price remains steady above the $120 support after the recent crypto market pullback. The…
- Price Analysis
Ethereum Price Risks Crash to $2,500 Amid Sustained Wintermute Dumping
Ethereum price dropped below the key support at $3,000 on Tuesday, down by ~40% from…
- Price Analysis
Is It Time to Sell Bitcoin for Gold- Analyst Spots 2023 Pattern That Triggered BTC’s Last Major Rally
The Stock Market rose modestly as crypto market consolidation sparked a fresh Bitcoin vs Gold…
- Price Analysis
Bitcoin Price Prediction and Analysis: Will BTC Hit $100k Before Year-End?
Bitcoin price moves into the final trading sessions with uncertainty around upside continuation. BTC price…
- Price Analysis
Bitcoin Price Prediction As Michael Saylor Pauses BTC Purchase- Is A Fall to $74k Imminent?
Michael Saylor's Strategy has paused additional BTC purchases while increasing cash reserves, prompting renewed speculation…