Will LUNC Price Surpass $0.00007? Bullish Pattern Signals a Green Light
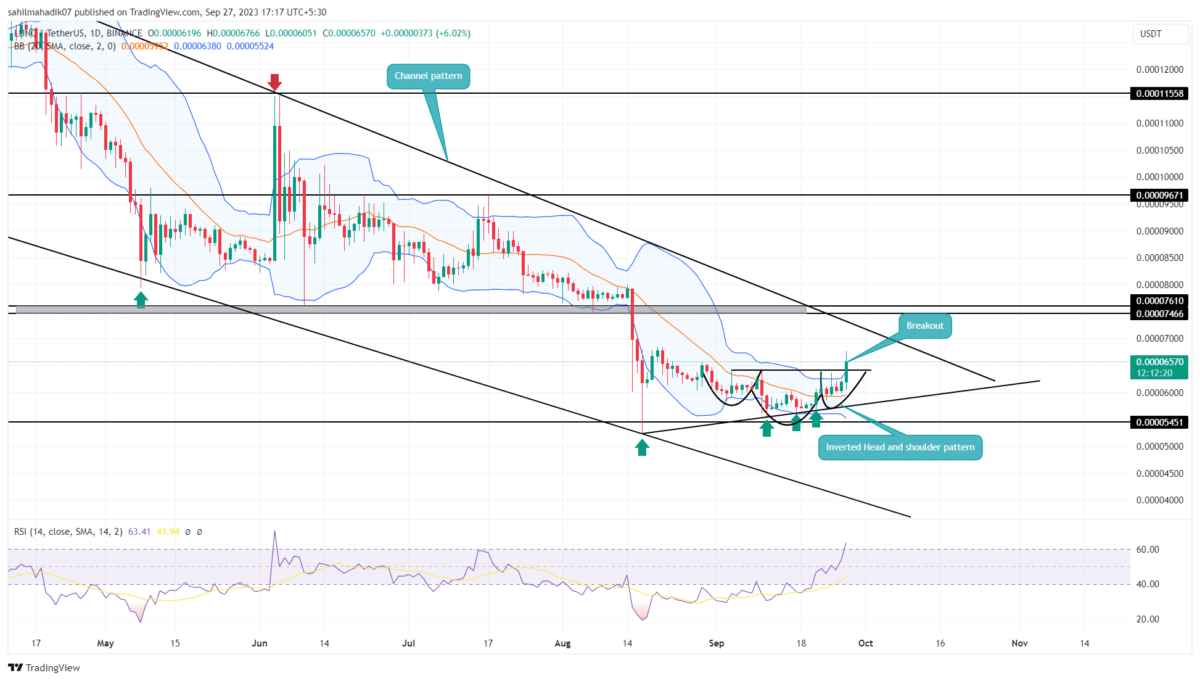
For almost six weeks, the LUNC price has witnessed high volatility, establishing a short-term sideways trend. Within this consolidation period, an ascending support trendline has been acting as a cushion for buyers, preventing the coin from a significant downside. Recently, this trendline served as the base for an inverted head-and-shoulder pattern, signaling a likely bullish turn in the near future.
Also Read: Terra Luna Classic Community Votes To Reset Validator Commission; LUNC To Rally?
Chart Pattern Hints a Quick 6% Jump
- A bullish reversal pattern sets the LUNC price for a significant upswing.
- The rising price may face renewed selling pressure around $0.00007
- The intraday trading volume in the LUNC coin is $35.2 Million, indicating a 211% gain.
As the leading cryptocurrency Bitcoin faced a pullback from the $27,500 level, the Terra classic coin price also experienced selling pressure, particularly around the $0.000064 mark. In addition, the daily chart reveals that this level serves as the neckline for the aforementioned bullish reversal head-and-shoulder pattern.
This pattern is often observed at market bottoms and usually precedes significant upswings. At the time of writing, the LUNC price is trading at $0.000069, with an intraday gain of 8%. With this bullish uptick, the coin price gave a decisive breakout from the $0.000064 resistance, offering a strong foundation for bullish momentum.
A confirmed breakout could potentially lead to a 6% surge, targeting the $0.00007 mark. However, this aforementioned level wavering the resistance trendline of the channel pattern creates a zone of high supply pressure.
Is Current Recovery Sustainable?
The overhead resistance trendline is part of a longer-term channel pattern that has dictated the price behavior of this altcoin for over six months. Given the impending bullish activity, traders should prepare for potential resistance turning into supply pressure. At this juncture, any failure to break above this trendline could lead the coin back into the confines of its long-standing channel pattern, prompting another correction. Thus, a decisive bullish breakout is essential for initiating a sustained recovery in the LUNC coin.
- Bollinger Band: An uptick in the upper band of the Bollinger band indicator suggests a high momentum buying.
- Relative Strength Index: The daily RSI slope rising above 60% accentuates recovery sentiment among traders.
Recent Posts
- Price Analysis
Will Solana Price Hit $150 as Mangocueticals Partners With Cube Group on $100M SOL Treasury?
Solana price remains a focal point as it responds to both institutional alignment and shifting…
- Price Analysis
SUI Price Forecast After Bitwise Filed for SUI ETF With U.S. SEC – Is $3 Next?
SUI price remains positioned at a critical intersection of regulatory positioning and technical structure. Recent…
- Price Analysis
Bitcoin Price Alarming Pattern Points to a Dip to $80k as $2.7b Options Expires Today
Bitcoin price rebounded by 3% today, Dec. 19, reaching a high of $87,960. This rise…
- Price Analysis
Dogecoin Price Prediction Points to $0.20 Rebound as Coinbase Launches Regulated DOGE Futures
Dogecoin price has gone back to the spotlight as it responds to the growing derivatives…
- Price Analysis
Pi Coin Price Prediction as Expert Warns Bitcoin May Hit $70k After BoJ Rate Hike
Pi Coin price rose by 1.05% today, Dec. 18, mirroring the performance of Bitcoin and…
- Price Analysis
Cardano Price Outlook: Will the NIGHT Token Demand Surge Trigger a Rebound?
Cardano price has entered a decisive phase as NIGHT token liquidity rotation intersects with structural…