Will Newfound Recovery Push Maker Coin Price Above $1800?


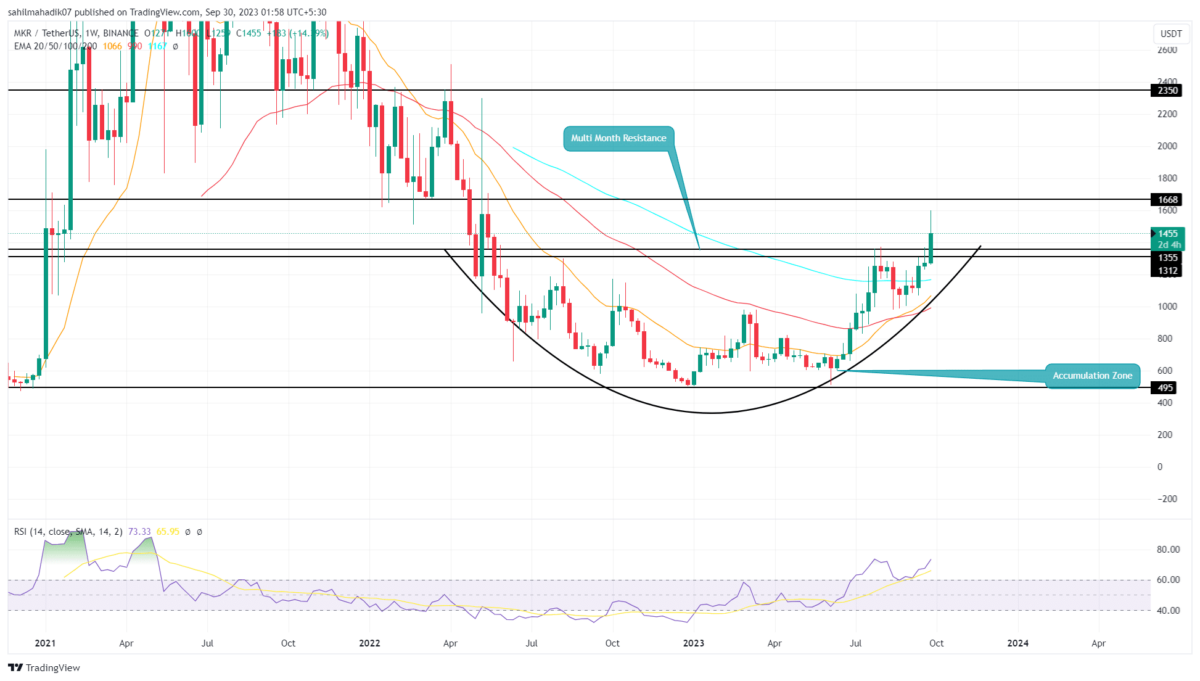
The weekly time frame chart for Maker coin price highlights a key shift in market dynamics. After a prolonged downtrend starting in May 2021 that saw the price hit a low around the $500 level, the asset entered a sideways trend in June 2022. This prolonged accumulation phase typically precedes a fresh bullish trend, suggesting a more optimistic future for the MKR price.
Also Read: Maker Price Rally Rages On As Active Addresses Hit 10-Week High
Will MKR Price Rise Back to $1800?
- The MKR coin price may face supply around the $1668 level
- A breakdown below $1610 support sets a potential fall to $1500
- The intraday trading volume in MKRer is $1.9 Billion, indicating a 33% loss
 Source- Tradingview
The Maker coin price has been on a recovery trajectory since June 2023 as the price rebounded from the support zone around $500. In the last 4 months, the coin price registered 185% to reach the current trading price of $1458. amid the ongoing recovery, the coin buyers have recently breached the horizontal resistance zone of $1355 to $1300.
A bullish breakout from this multi-month resistance should offer buyers a significant footing to bolster their further rally. However, with an intraday loss of 3.31%, the maker coin shows a minor pullback to retest the breach level. If the coin price shows sustainability above the e $1,355 mark, the buyers would get a strong foothold to prolong the recovery trend.
The post-breakout rally may push the coin price another 15% to reach $1668.
MKR vs BTC Performance
 Source: Coingape| Maker Vs Bitcoin Price
The last three months’ price action clearly defines the Maker coin outperformed Bitcoin price with its parabolic growth. While the MKR price shows a set of new higher highs and lows reflecting an established recovery, the BTC price shows an evident sideways trend.
Thus, this altcoin can be an interesting opportunity to buy if the bullish momentum persists,

Why Trust CoinGape
CoinGape has covered the cryptocurrency industry since 2017, aiming to provide informative insights Read more…to our readers. Our journal analysts bring years of experience in market analysis and blockchain technology to ensure factual accuracy and balanced reporting. By following our Editorial Policy, our writers verify every source, fact-check each story, rely on reputable sources, and attribute quotes and media correctly. We also follow a rigorous Review Methodology when evaluating exchanges and tools. From emerging blockchain projects and coin launches to industry events and technical developments, we cover all facets of the digital asset space with unwavering commitment to timely, relevant information.