Will SHIB Price Reclaim $0.00001? Triangle Pattern Sets a 40% Recovery


Amid the increasing FUD in the crypto market, the SHIB price correction phase went sideways above the $0.00000725-$0.000007 support zone. The narrow consolidation resonating between two converging trendlines indicates the formation of a symmetrical triangle pattern. The coin price close to the triangle peak indicates an opportunity for a decisive breakout is near; time to go bullish?
Also Read: Memecoins Like Pepe Coin, DOGE, And Shiba Inu Outpace Stablecoins In Gas Fees
Shiba Inu Daily Chart: Key Points
- The triangle pattern breakout would trigger a directional move in the SHIB price
- A bearish crossover between the 20 and 50 days would accelerate the selling pressure.
- The intraday trading volume of the Shiba Inu coin is $120.8 Million, showing a 26% gain.
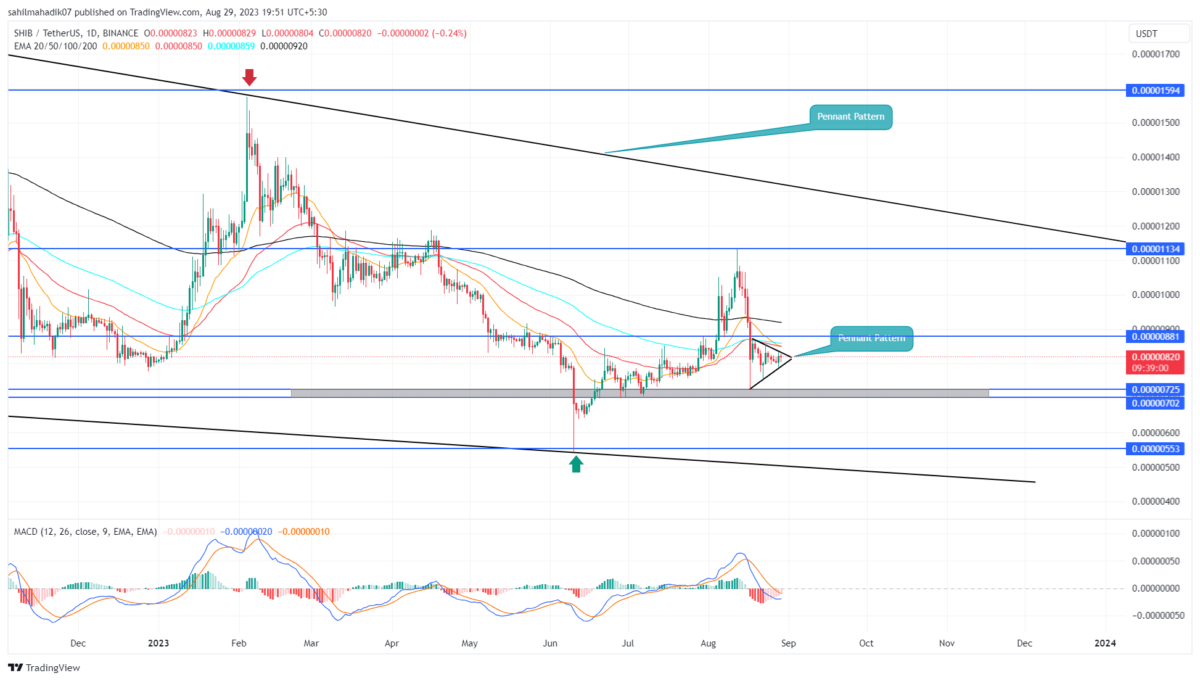
 Source- Tradingview
The daily time frame chart projects the Shiba Inu coin price is following a steady downtrend under the influence of a falling wedge pattern. In June, the buyers initiated a new recovery cycle within the pattern’s channel and reached a high of $0.00001136.
However, the August correction plunged the SHIB price 28.8% down to waver above the $0.00000725 support. By press time, this popular memecoin trades at $0.000008 and is narrowing within the triangle pattern.
If the bullish momentum rises, the coin buyers may breach the upper trendline as a signal to continue the recovery trend. The post-breakout rally may surge the prices by 40% to rechallenge the resistance at $0.00001136.
What if SHIB Price Breaks Below the Support Trendline?
While the bullish outlook seems valid from price behavior, the increasing uncertainty in the crypto market may trigger a different approach. The triangle pattern is often considered a trend continuation setup indicating that the SHIB price also holds a possibility to break the lower trendline. This bearish breakdown below the lower trendline with daily candle closing will surge the selling momentum and may plunge the prices below $0.000007 support.
- Exponential Moving Average: The coin price trading below the daily EMAs(20, 50, 100, and 200) indicates the traders would face the least resistance on the downside.
- Directional Movement Index: A MACD(blue) and signal(orange) nearing a bullish crossover support the potential of a bullish upswing.

Why Trust CoinGape
CoinGape has covered the cryptocurrency industry since 2017, aiming to provide informative insights Read more…to our readers. Our journal analysts bring years of experience in market analysis and blockchain technology to ensure factual accuracy and balanced reporting. By following our Editorial Policy, our writers verify every source, fact-check each story, rely on reputable sources, and attribute quotes and media correctly. We also follow a rigorous Review Methodology when evaluating exchanges and tools. From emerging blockchain projects and coin launches to industry events and technical developments, we cover all facets of the digital asset space with unwavering commitment to timely, relevant information.
Related Articles


- Gold vs. Bitcoin: Will BTC Be the Next Global Reserve Currency? Peter Schiff Says No
- Experts Advise Caution As Crypto Market Heads Into A Bearish Week Ahead
- Bitget’s TradFi Daily Volume Doubles to $4B as Crypto Traders Diversify Into Gold, Silver
- Breaking: Senate Committee Moves Crypto Bill Markup To January 29 as Government Shutdown Looms
- Breaking: Tom Lee’s Bitmine Acquires 40,302 ETH as Whales Double Down On Ethereum
- XRP Price Prediction as Ripple Scores Big Partnership in Cash-Rich Saudi Arabia
- Bitcoin Price Prediction As Gold Breaks All-Time High
- Bitcoin and XRP Price At Risk As US Govt. Shutdown Odds Reach 73%
- PEPE vs PENGUIN: Can Pengu Price Outperform Pepe Coin in 2026?
- Binance Coin Price Outlook As Grayscale Files S-1 for BNB
- Solana Price Prediction as SOL ETF Inflows Outpace BTC and ETH Together


