Will SHIB Price Reclaim $0.00001? Triangle Pattern Sets a 40% Recovery
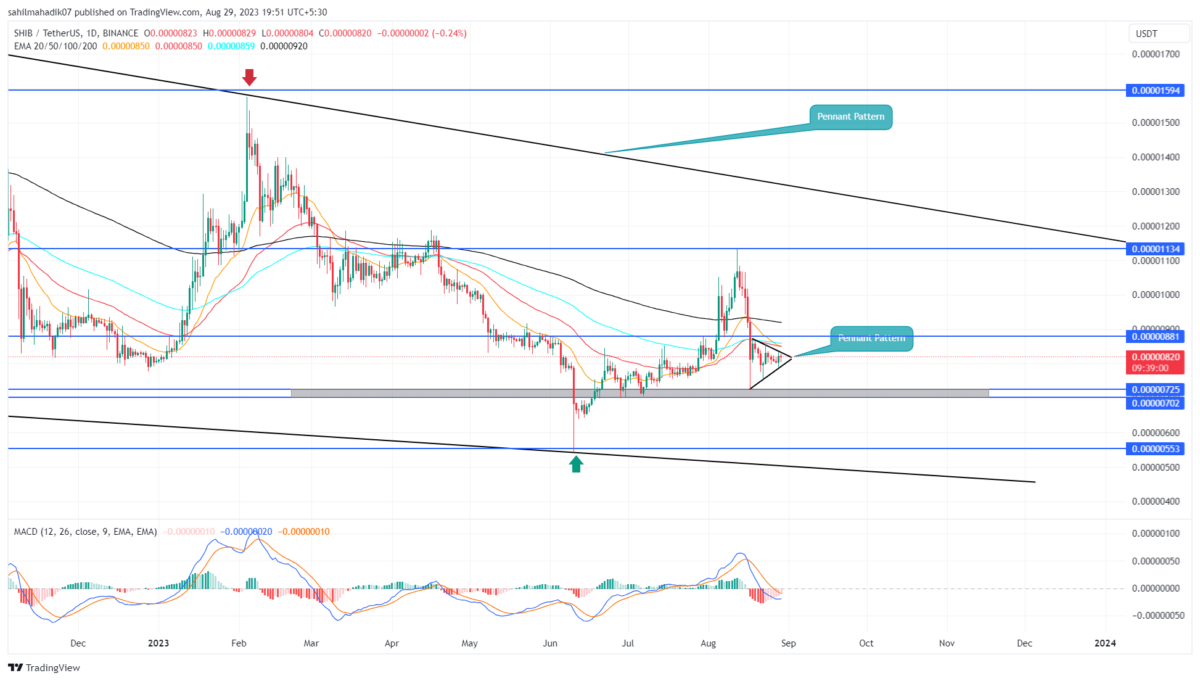
Amid the increasing FUD in the crypto market, the SHIB price correction phase went sideways above the $0.00000725-$0.000007 support zone. The narrow consolidation resonating between two converging trendlines indicates the formation of a symmetrical triangle pattern. The coin price close to the triangle peak indicates an opportunity for a decisive breakout is near; time to go bullish?
Also Read: Memecoins Like Pepe Coin, DOGE, And Shiba Inu Outpace Stablecoins In Gas Fees
Shiba Inu Daily Chart: Key Points
- The triangle pattern breakout would trigger a directional move in the SHIB price
- A bearish crossover between the 20 and 50 days would accelerate the selling pressure.
- The intraday trading volume of the Shiba Inu coin is $120.8 Million, showing a 26% gain.
The daily time frame chart projects the Shiba Inu coin price is following a steady downtrend under the influence of a falling wedge pattern. In June, the buyers initiated a new recovery cycle within the pattern’s channel and reached a high of $0.00001136.
However, the August correction plunged the SHIB price 28.8% down to waver above the $0.00000725 support. By press time, this popular memecoin trades at $0.000008 and is narrowing within the triangle pattern.
If the bullish momentum rises, the coin buyers may breach the upper trendline as a signal to continue the recovery trend. The post-breakout rally may surge the prices by 40% to rechallenge the resistance at $0.00001136.
What if SHIB Price Breaks Below the Support Trendline?
While the bullish outlook seems valid from price behavior, the increasing uncertainty in the crypto market may trigger a different approach. The triangle pattern is often considered a trend continuation setup indicating that the SHIB price also holds a possibility to break the lower trendline. This bearish breakdown below the lower trendline with daily candle closing will surge the selling momentum and may plunge the prices below $0.000007 support.
- Exponential Moving Average: The coin price trading below the daily EMAs(20, 50, 100, and 200) indicates the traders would face the least resistance on the downside.
- Directional Movement Index: A MACD(blue) and signal(orange) nearing a bullish crossover support the potential of a bullish upswing.
Recent Posts
- Price Analysis
FUNToken Price Surges After MEXC Lists $FUN/USDC Pair
FUNToken, one of the most talked-about low-cap cryptos on the market with P2E undertones, has…
- Price Analysis
Bitcoin Price on Edge as $24B Options Expire on Boxing Day — Is $80K About to Crack?
Bitcoin enters the final stretch of the year with the price behavior signaling a decisive…
- Price Analysis
Crypto Market Rebounds: Are Bulls Positioning for a Santa Rally?
Crypto markets saw a 0.94% rise in the last 24 hours, contributing to a…
- Price Analysis
XRP, Bitcoin, Ethereum Price Predictions Ahead of Jan 2026 CLARITY Act and US Crypto Reserve Plans
The XRP, Bitcoin, and Ethereum prices remained in a bear market after falling by over…
- Price Analysis
Pi Network Analysis: Pi Coin Price Surges on Christmas Eve, Can It Hit Year-End Highs?
Pi coin price reflect cautious positioning as market structure tightens near a key base. The…
- Price Analysis
Why Dec 26th Is A Do Or Die for Bitcoin Price Ahead Of Record Options Expiry?
As Christmas winds down, the Bitcoin price dipped 0.74% to around $86,750. Market participants…