Will Solana Price Hit $30 Again? Bullish Pattern Sparks Fresh Recovery for $SOL Buyers
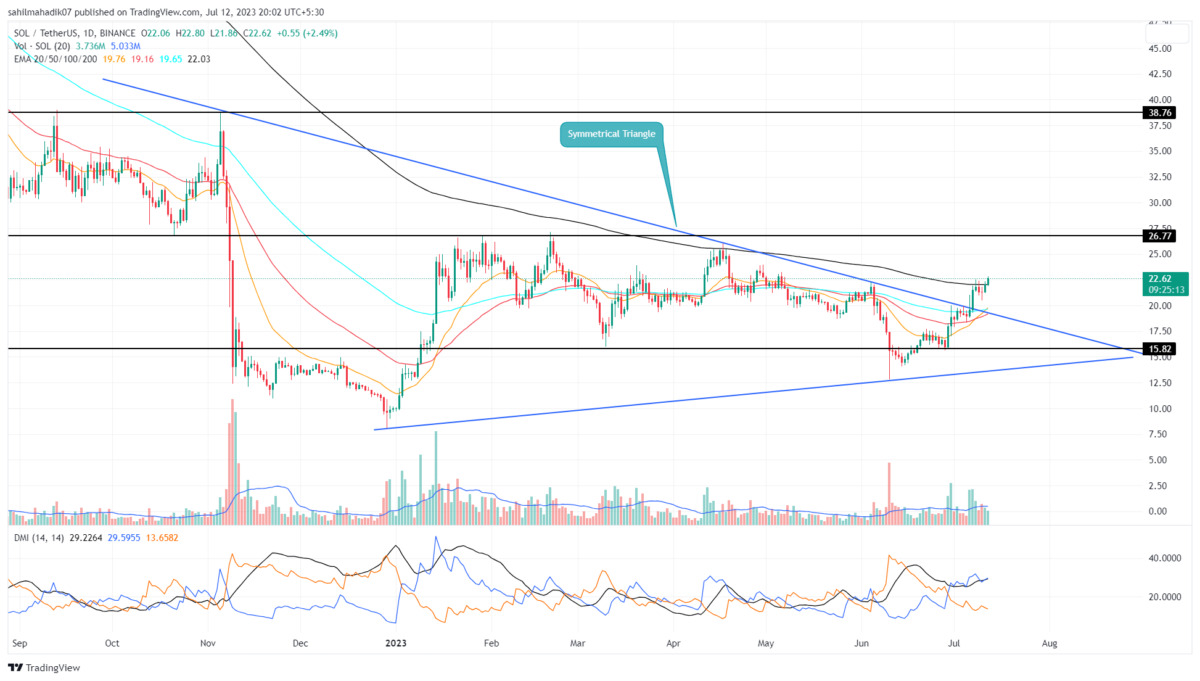
On July 7th, the Solana price provides a significant breakout from the resistance trendline of the symmetrical triangle pattern. This breakout signals a change in market trend and a potentially strong rally. Here are the predetermined targets for this chart pattern if the bullish momentum sustains.
Also Read: Veteran Investor Raoul Pal Predicts A 20x Rally in Solana (SOL) Price
Solana Price Daily Chart
- The fast recovery SOL price could face first resistance at $26.7.
- The recently reclaimed200-day EMA could act as strong support for market buyers
- The 24-hour trading volume on the Solana coin is $486..5 Million, indicating an 11% loss.
In the last six days, the Solana price has surged 13% from a $19.6 breakout point. This growth despite an uncertain market sentiment provides suitable follow-up for buyers and conviction for further rally.
In theory, a bullish breakout from the symmetrical triangle pattern provides a rally to upswings formed during the development of this structure and the distance between its broadest swing shot from the breakout point.
Thus, with sustained buying, the SOL price could reach $26.7, followed by $38.6, and $50.
[converter id=”sol-solana” url=”https://coingape.com/price/converter/sol-to-usd/?amount=1″]
Can SOL Price Go Back To 20?
By the press time, the Solana price trades at $22.4 mark, with an intraday gain of 1.8%. However, the rejection wick attached to the daily candle reflects a possible pullback if the sellers manage a closing below the 200-day EMA. This closing could tumble the prices back to $19.8 before continuing the bullish rally.
- Exponential Moving Average: After spending over 450 days below the 200-day EMA, the buyers have managed to reclaim this slope with the potential to carry a new bullish trend.
- Average Directional Index: The uptick in the daily ADX slope reflects the strength of buyers to lead a strong rally.
Recent Posts
- Price Analysis
FUNToken Price Surges After MEXC Lists $FUN/USDC Pair
FUNToken, one of the most talked-about low-cap cryptos on the market with P2E undertones, has…
- Price Analysis
Bitcoin Price on Edge as $24B Options Expire on Boxing Day — Is $80K About to Crack?
Bitcoin enters the final stretch of the year with the price behavior signaling a decisive…
- Price Analysis
Crypto Market Rebounds: Are Bulls Positioning for a Santa Rally?
The crypto market showed signs of recovery on Christmas Day, gaining 0.67% in the…
- Price Analysis
XRP, Bitcoin, Ethereum Price Predictions Ahead of Jan 2026 CLARITY Act and US Crypto Reserve Plans
The XRP, Bitcoin, and Ethereum prices remained in a bear market after falling by over…
- Price Analysis
Pi Network Analysis: Pi Coin Price Surges on Christmas Eve, Can It Hit Year-End Highs?
Pi coin price reflect cautious positioning as market structure tightens near a key base. The…
- Price Analysis
Why Dec 26th Is A Do Or Die for Bitcoin Price Ahead Of Record Options Expiry?
As Christmas winds down, the Bitcoin price dipped 0.74% to around $86,750. Market participants…