Will This Bullish Pattern Boost Solana Price To $48
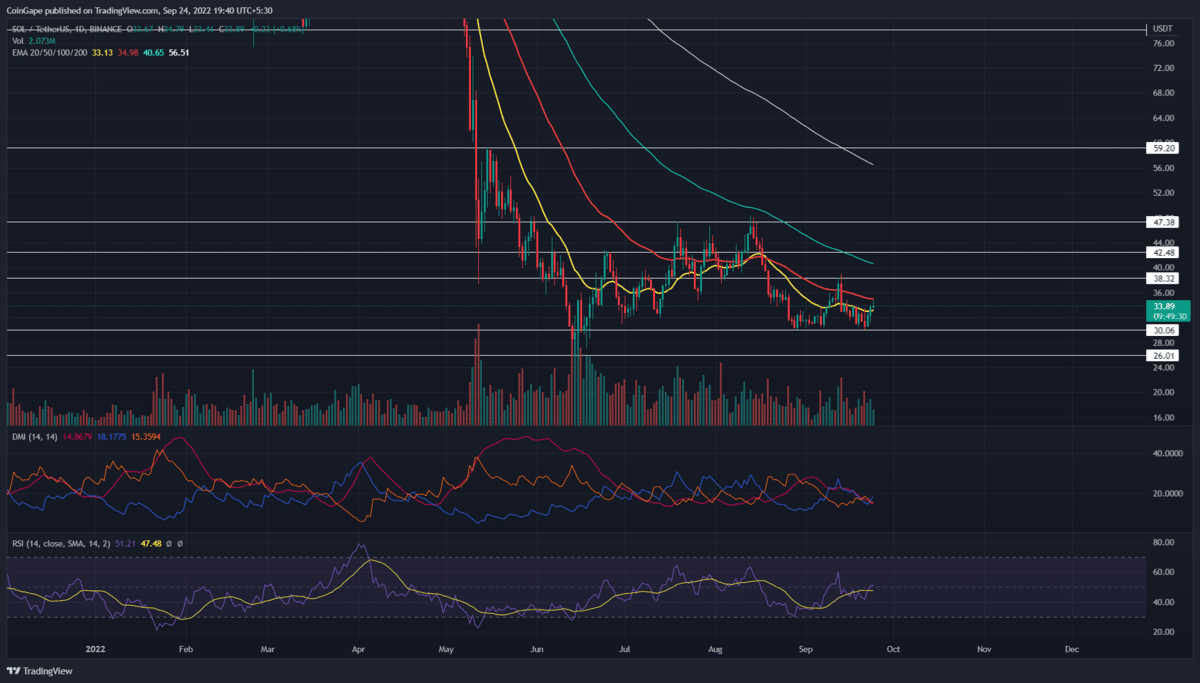
The Solana (SOL) price displays a bullish reversal opportunity with a double bottom pattern at the psychological Mark of $30. However, the declining 50-day EMA opposes the bullish growth to reach the neckline at $38. So, should you consider taking a bullish trade or wait until prices exceed $38?
Key points From SOL Technical Analysis:
- The Solana price rose 10% in the last 48 hours.
- The daily-RSI slope spikes slightly above the halfway line reflecting.
- The 24-hour trading volume in the Solana coin is $1.04 Billion, indicating a 19% gain.
Source-Tradingview
During the last few bearish weeks, the SOL/USDT chart shows the Solana market price declined sharply to reach the bottom crucial support level at $30. The correction coincides with a reversal from the 100-day EMA accounting for a bear cycle of 20%, undermining the previous recovery rally seen in July.
The bear cycle, however, fails to break the psychological Mark of $30, leaving a consolidation with the overhead resistance of $38. Additionally, the bullish resurfacing influence over the consolidation range teases a double bottom which generally forecasts a reversal from a notion formed at a solid base level.
The consolidation’s ceiling at $38 acts as the neckline of the bullish pattern and the recent reversal of 10% over the last two days cements the idea of a trend reversal. Hence, optimistic swing traders can find buying opportunities at the current market price.
However, the traders waiting for a breakout entry opportunity will have to be patient till the Solana market price surpasses the $38 neckline. The bullish pattern gives the next target as the $47 horizontal level.
However, considering the reversal rally fails to exceed the 50-day EMA, the double bottom theory will be nullified, potentially leading to a drop to $30.
Technical indicator
The rising RSI slope peaks above the halfway line supporting the bullish reversal theory by indicating a rise in the underlying bullishness. However, the sideways trend in the midterm reflects a bullish turmoil over the trend control.
The declining trend in the crucial daily EMAs displays an overall downtrend, with the 50-day EMA providing resistance to the recovery rally.
- Resistance level- $38 and $47.2
- Support levels- $30 and $25
Recent Posts
- Price Analysis
Is $1 Dogecoin Price Technically Possible in 2026?
As the years draw to a close, Dogecoin trades above $0.12 amid a broader crypto…
- Price Analysis
Bitcoin Price Year-End Prediction: Analysts Highlight Key Levels Before 2025 Close
Bitcoin price hovered at $87,755 on December 28, 2025, as the year came to an…
- Price Analysis
Pi Network Price Holds $0.20 After 8.7M PI Unlock, 19M KYC Milestone-What’s Next?
Pi Network price continues to trade just above the crucial $0.20 support, despite ongoing weakness…
- Price Analysis
XRP Price Prediction Ahead of US Strategic Crypto Reserve
As the year comes to an end, XRP price hovers near the $1.80 support level,…
- Price Analysis
Ethereum Price Prediction Ahead of the 2026 Glamsterdam Scaling Upgrade – Is $5,000 Back in Play?
Ethereum price is in a critical stage as ETH price is in line with the…
- Price Analysis
Cardano Price Eyes a 40% Surge as Key DeFi Metrics Soar After Midnight Token Launch
Cardano price remains in a deep bear market, continuing a sell-off that started in December…