Will Winning Streak in SOL Price Reclaim $30 Mark?


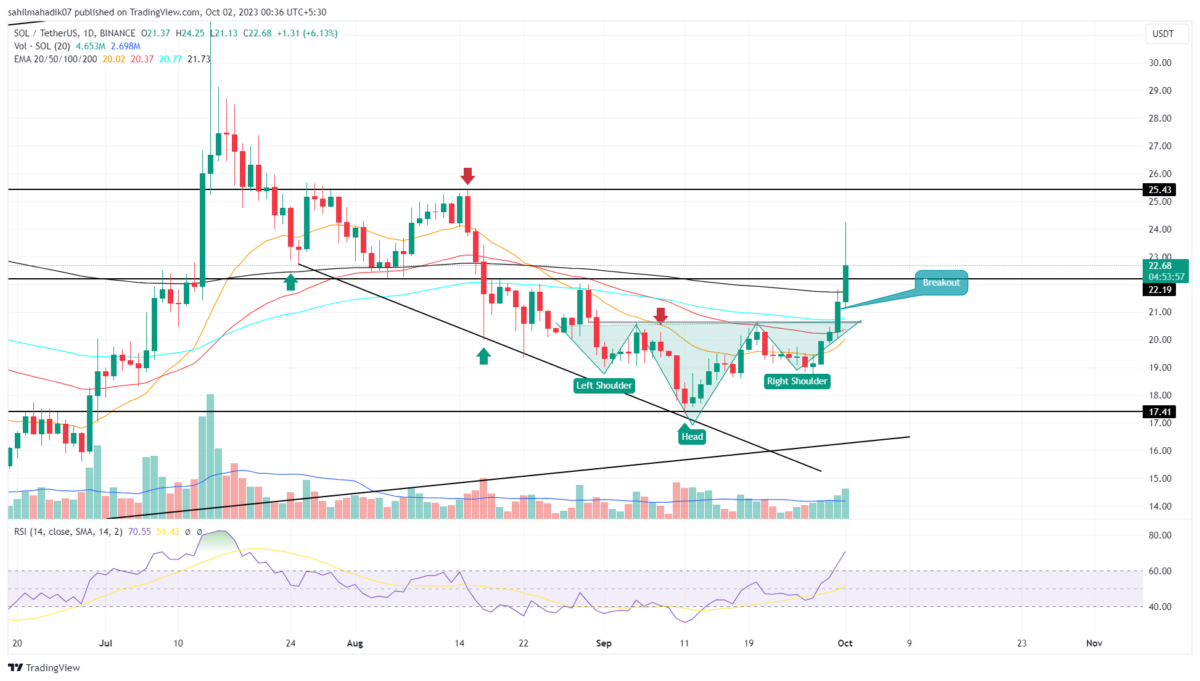
In the midst of a broader crypto market upswing, the Solana price has been riding a veritable wave of bullish momentum. Over a five-day winning streak on the daily chart, the coin price action completed an inverted head and shoulders pattern, a common bottoming formation that often signals a reversal in bearish sentiment. On October 30th, this pattern culminated in a decisive breakout above the $20.8 resistance level, further fueling the altcoin’s upward trajectory.
Also Read: Solana Registers Surprise 10% Jump Toppling Dogecoin, Next SOL Price Target $32?
Is Current Recovery Sustainable?
- The reclaimed 200-day EMA could offer strong support to the buyers.
- A bullish breakout from the overhead trendline would set the coin by 11%.
- The 24-hour trading volume on the Solana coin is $161.4 Million, indicating a 13% gain.
 Source-Tradingview
On September 30th, the Solana price confirmed the pattern’s efficacy by breaking through the neckline of the inverted head and shoulders formation. This technical breakout was substantiated by an intraday gain of 5.5% today, pushing the price to breach yet another horizontal resistance at $22.2.
Trading at $22.5 at the time of this analysis, these recently pierced resistance levels may now serve as robust support zones during any market pullbacks. Should the SOL price maintain its foothold above $22.1, we could see buyers propel the price by another 13%, targeting the $25.5 zone.
However, caution is advised as the long wick rejection around the $24 mark on the daily chart suggests a potential minor pullback, providing traders with a potential re-entry point during a retest.
[converter id=”sol-solana” url=”https://coingape.com/price/converter/sol-to-usd/?amount=1″]
SOL vs BTC Performance
 Source: Coingape| Solana Vs Bitcoin Price
Comparative analysis over the past three months reveals that SOL has outshone BTC in terms of recovery, especially in the last week. While the Bitcoin price has shown a more tepid bounce back, indicating a short-term sideways trend, The Solana price has not only displayed a stronger recovery but also formed its first higher low—a generally bullish indicator.
- Relative Strength Index: The daily RSI slope above 60% reflects sufficient bullish momentum for an upswing.
- Exponential Moving Average: The reclaimed daily EMAs(20, 50, 100, a200) could offer buyer additional edge

Why Trust CoinGape
CoinGape has covered the cryptocurrency industry since 2017, aiming to provide informative insights Read more…to our readers. Our journal analysts bring years of experience in market analysis and blockchain technology to ensure factual accuracy and balanced reporting. By following our Editorial Policy, our writers verify every source, fact-check each story, rely on reputable sources, and attribute quotes and media correctly. We also follow a rigorous Review Methodology when evaluating exchanges and tools. From emerging blockchain projects and coin launches to industry events and technical developments, we cover all facets of the digital asset space with unwavering commitment to timely, relevant information.

Related Articles


- U.S. CFTC Committee Appoint Ripple, Coinbase, Robinhood CEOs to Boost Crypto Regulation
- What Will Spark the Next Bitcoin Bull Market? Bitwise CIO Names 4 Factors
- U.S. CPI Release: Wall Street Predicts Soft Inflation Reading as Crypto Market Holds Steady
- Bhutan Government Cuts Bitcoin Holdings as Standard Chartered Predicts BTC Price Crash To $50k
- XRP News: Binance Integrates Ripple’s RLUSD on XRPL After Ethereum Listing
- Solana Price Prediction as $2.6 Trillion Citi Expands Tokenized Products to SOL
- Bitcoin Price Could Fall to $50,000, Standard Chartered Says — Is a Crash Coming?
- Cardano Price Prediction Ahead of Midnight Mainnet Launch
- Pi Network Price Prediction as Mainnet Upgrade Deadline Nears on Feb 15
- XRP Price Outlook Amid XRP Community Day 2026
- Ethereum Price at Risk of a 30% Crash as Futures Open Interest Dive During the Crypto Winter


