XRP Price Analysis: Bullish Pattern Sets $XRP Price to Surpass $0.55; Buy Now?
XRP Price Analysis: On June 19th, the ongoing bullish recovery in XRP price gave an upswing breakout from $0.487 resistance. This breakout should offer buyers another setup stone to prolong the bullish recovery and reclaim the lost ground. Currently, the altcoin is trading at $0.49 and trying to sustain above the breached resistance. Can this recovery surpass the multi-month resistance of $0.55?
Also Read: XRP Was Marked For Death, Says Bitcoin Maxi; XRP Lawyer, Ripple CTO Replies
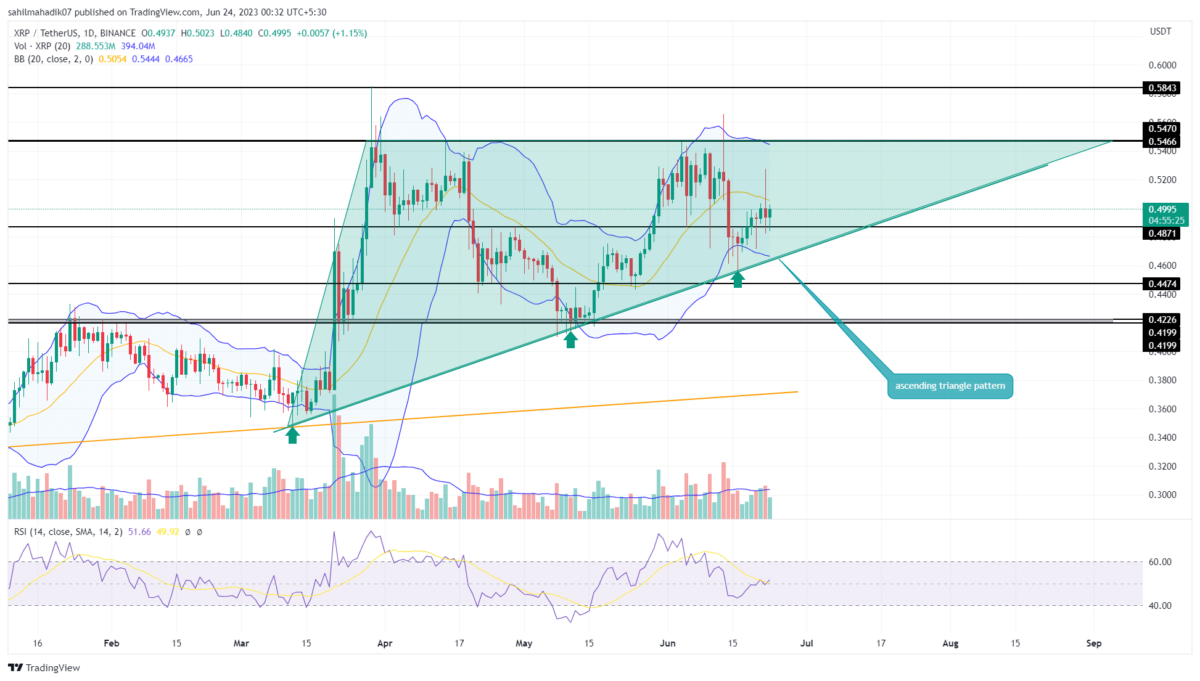
XRP Price Daily Chart:
- In theory, the higher lows formed during the development of the triangle pattern reflect the gradual growth in bullish momentum
- The XRP price may face high selling pressure at $0.55
- The intraday trading volume in the XRP is $1.04 Billion, indicating a 33% loss.
Over the past few days, the XRP price has been wavering above the recently reclaimed $0167 resistance. During this consolidation, the daily candles showed some long tail rejections indicating the buyers are actively defending the new flipped support.
If the bullish momentum persists, the XRP price is likely to surge 9.6% and rechallenge the $0.55 resistance. Thus, the aforementioned multi-month resistance is also the neckline resistance of the triangle pattern, and therefore it stands as a high supply zone against buyers.
Until the overhead resistance and rising trendline are intact, the XRP price would continue with its sideways trend.
Is This the Right Time to Buy XRP?
In the daily time frame chart, the XRP price shows the formation of an ascending triangle pattern. This pattern gradually increased the underlying bullish momentum and set the asset for a breakout above neckline resistance. Thus, potential investors waiting for any entry opportunity could enter at the rising trendline or for more convicting wait for $0.55 breakout.
- Relative Strength Index: The daily RSI slope at 50% reflects a neutral sentiment in the market.
- Bollinger Band: The flattish bands of Bollinger band indicator project a volatile market and the likelihood of a prolonged sideways trend.
Recent Posts
- Price Analysis
Will Solana Price Hit $150 as Mangocueticals Partners With Cube Group on $100M SOL Treasury?
Solana price remains a focal point as it responds to both institutional alignment and shifting…
- Price Analysis
SUI Price Forecast After Bitwise Filed for SUI ETF With U.S. SEC – Is $3 Next?
SUI price remains positioned at a critical intersection of regulatory positioning and technical structure. Recent…
- Price Analysis
Bitcoin Price Alarming Pattern Points to a Dip to $80k as $2.7b Options Expires Today
Bitcoin price rebounded by 3% today, Dec. 19, reaching a high of $87,960. This rise…
- Price Analysis
Dogecoin Price Prediction Points to $0.20 Rebound as Coinbase Launches Regulated DOGE Futures
Dogecoin price has gone back to the spotlight as it responds to the growing derivatives…
- Price Analysis
Pi Coin Price Prediction as Expert Warns Bitcoin May Hit $70k After BoJ Rate Hike
Pi Coin price rose by 1.05% today, Dec. 18, mirroring the performance of Bitcoin and…
- Price Analysis
Cardano Price Outlook: Will the NIGHT Token Demand Surge Trigger a Rebound?
Cardano price has entered a decisive phase as NIGHT token liquidity rotation intersects with structural…