XRP Price Analysis: XRP Bulls Must Defend This Price Level To Avoid Major Correction
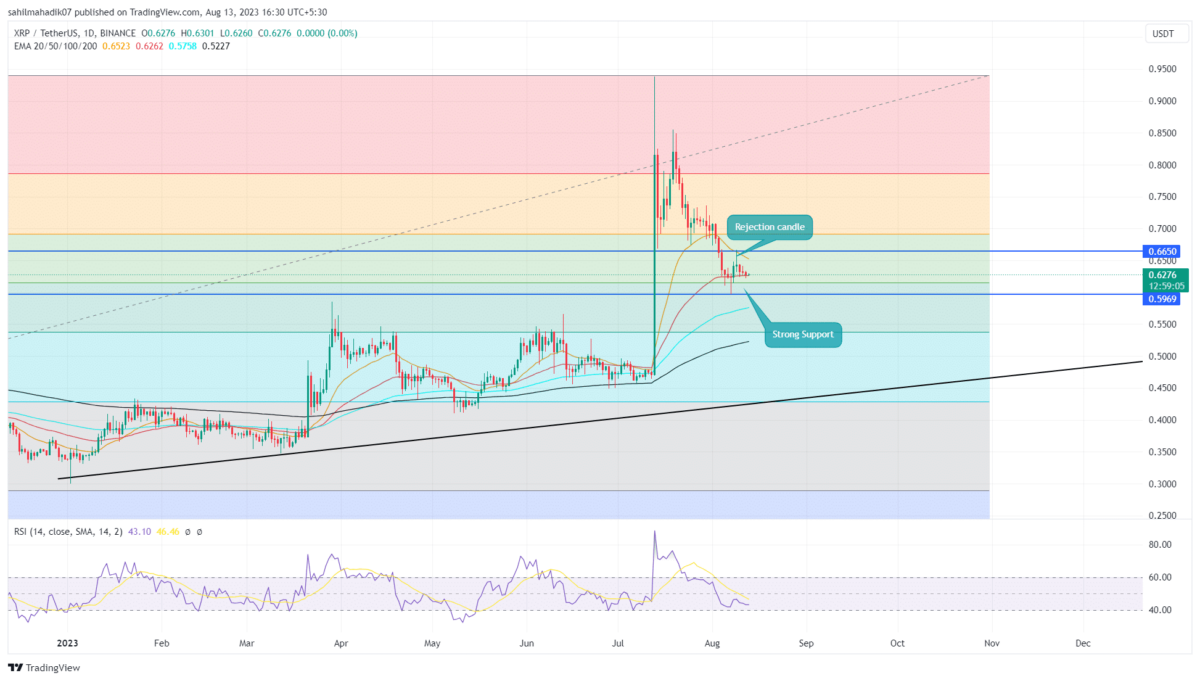
The ongoing correction phase in XRP price from suitable support at the $0.6 level. Amid the three weeks downfall, the altcoin registered a 36.5% loss as the price dropped from the July 13th high of $0.938 to the $0.596 low. The aforementioned support aligned with the 50% Fibonacci retracement level creates a strong footing for buyers to replenish bullish momentum. Should you enter this dip?
XRP News: Gemini Relists XRP Token, Opens Support For XRP Ledger (XRPL)
XRP Chart: Key Points
- The XRP buyers can witness strong demand pressure from $0.6 support
- A bullish breakout from the overhead resistance of $0.665 could bolster buyers for 10.8
- The intraday trading volume in the XRP is $504 Billion, indicating a 22.12% loss.
On August 7th, the XRP price bounced back from the $0.6 support as an attempt from buyers to reclaim higher ground. However, after a short jump of 11.4%, the coin price faced immediate resistance at $0.665.
The rejection candle at this barrier indicates the traders still follow the sentiment of selling on bounces, observed in an established downtrend. The bearish reversal undermined the 6.55% gain of the prior upswing as the XRP price currently trades at $0.627.
The declined price is expected to rechallenge the $0.6 support combined with 50% FIB. In theory, a correction to 0.5% FIB is healthy for a long-term trend whereas a downfall below starts to reflect weakness in bullish momentum.
Thus, a breakdown below $0.6 could threaten the XRP holders for a major correction.
[converter id=”xrp-xrp” url=”https://coingape.com/price/converter/xrp-to-usd/?amount=1″]
XRP Buyers Need to Watch Support Level
If the falling XRP price witnesses another surge of buying pressure to $0.6, it would indicate the buyers are accumulating a discounted price. This demand pressure could trigger a sideways action for a few trading days, offering buyers an opportunity to regain strength. Thus a potential breakout from the $0.665 barrier would give the first signal for recovery.
- Exponential Moving Average: The altcoin price trading above 100-and-200-day EMA indicates the overall trend remains bullish.
- Relative Strength Index: The RSI slope of 40% reflects the buyers having enough momentum to carry a bullish reversal.
Recent Posts
- Price Analysis
Will Solana Price Hit $150 as Mangocueticals Partners With Cube Group on $100M SOL Treasury?
Solana price remains a focal point as it responds to both institutional alignment and shifting…
- Price Analysis
SUI Price Forecast After Bitwise Filed for SUI ETF With U.S. SEC – Is $3 Next?
SUI price remains positioned at a critical intersection of regulatory positioning and technical structure. Recent…
- Price Analysis
Bitcoin Price Alarming Pattern Points to a Dip to $80k as $2.7b Options Expires Today
Bitcoin price rebounded by 3% today, Dec. 19, reaching a high of $87,960. This rise…
- Price Analysis
Dogecoin Price Prediction Points to $0.20 Rebound as Coinbase Launches Regulated DOGE Futures
Dogecoin price has gone back to the spotlight as it responds to the growing derivatives…
- Price Analysis
Pi Coin Price Prediction as Expert Warns Bitcoin May Hit $70k After BoJ Rate Hike
Pi Coin price rose by 1.05% today, Dec. 18, mirroring the performance of Bitcoin and…
- Price Analysis
Cardano Price Outlook: Will the NIGHT Token Demand Surge Trigger a Rebound?
Cardano price has entered a decisive phase as NIGHT token liquidity rotation intersects with structural…