XRP Price Analysis: Can $0.5 Support Mark a Turning Point in Correction?
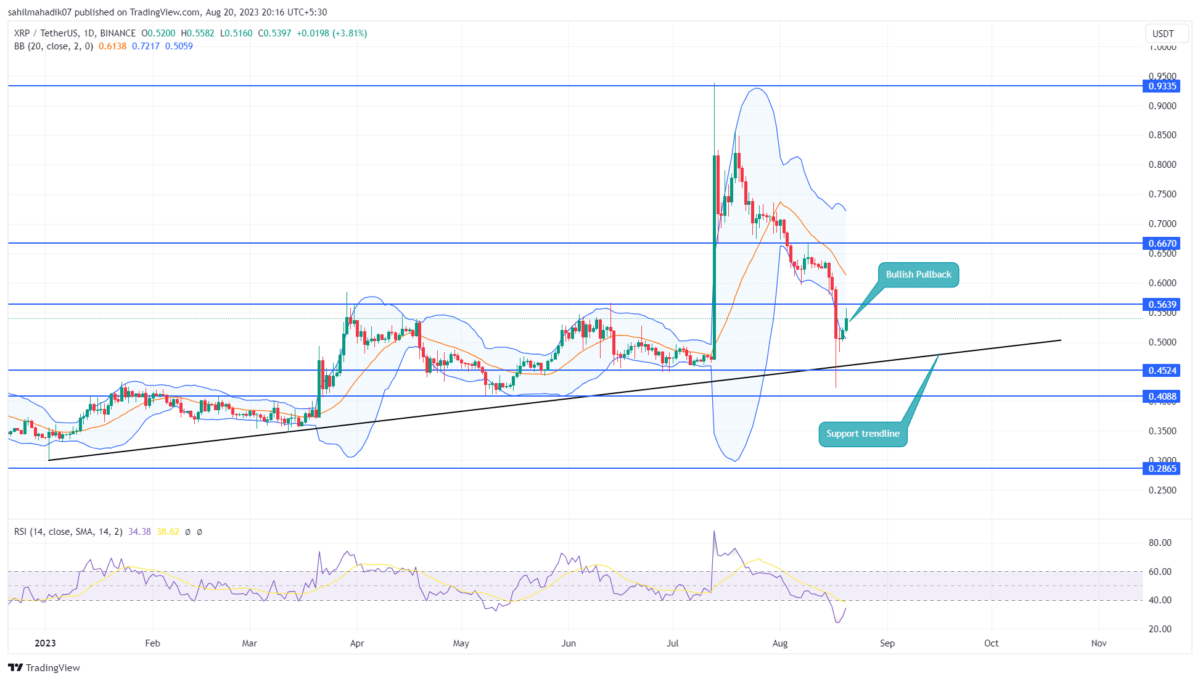
The XRP price has been in a correction phase for over a month now, where it plunged from the top of $0.938 to $0.4226 low accounting for a 54.5% loss. However, this falling price found suitable support at the long-coming support trendline aligned with the $0.5 psychological level, offering buyers a platform to counterattack. Can these support bolster buyers for a fresh recovery rally?
Also Read: Ripple Now In Bank for International Settlements (BIS) Panel; XRP Rally Ahead?
XRP Daily Chart: Key Points
- An ascending trendline keeps the long-term trend bullish for XRP holders
- An upside breakout from the $0.5948 mark may bolster a bullish recovery
- The intraday trading volume in the XRP is $1.6 Billion, indicating a 42% gain.
Although the significant sell-off on August 17th breached the $0.564 support, the daily chart indicated that by the close of the day, more than half of the intraday loss had been regained. A long-wick rejection attached to the daily candle reflects the accumulation of buyers at a discounted price.
This rejection sign came at the combined support ascending support trendline aligned and $0.5 psychological level, offering buyers a suitable footing to turn the price higher. With an intraday of 4.67%, the XRP price currently trades at $0.54 and is likely to retest the $0.564 resistance.
For the XRP coin to undermine the prior breakdown, the buyers need to break above the August 17th high of $0.5948. This breakdown will break the seller’s weapon and bolster buyers for recovery to $0.667, followed by $0.854, and $0.933.
[converter id=”xrp-xrp” url=”https://coingape.com/price/converter/xrp-to-usd/?amount=1″]
Will XRP Correction Fall Below $0.5?
The XRP holders must closely watch the price retest to the recently reclaimed resistance of $0.564. This retest could determine the possibility of further downfall or trend reversal. If the altcoin price shows suitability below the aforementioned level, the sellers may reattempt to break below $0.5 or ascending support trendline.
- Bollinger Band: A downtick in the lower band of the Bollinger band indicator shows the bearish momentum in active.
- Relative Strength Index: The RSI slope potential break above the 40% mark would offer additional confirmation on a bullish reversal.
Recent Posts
- Price Analysis
Solana Price Prediction: How High Could SOL Go in January 2026?
Solana price showed signs of strength in early January 2026, hovering near $127 after a…
- Price Analysis
Top 3 Price Predictions for Bitcoin, Ethereum and XRP for 2026 According to Analysts
Bitcoin price, Ethereum price, and XRP price show renewed strength heading into 2026 after daily…
- Price Analysis
Is $1 Dogecoin Price Technically Possible in 2026?
As the years draw to a close, Dogecoin trades above $0.12 amid a broader crypto…
- Price Analysis
Bitcoin Price Year-End Prediction: Analysts Highlight Key Levels Before 2025 Close
Bitcoin price hovered at $87,755 on December 28, 2025, as the year came to an…
- Price Analysis
Pi Network Price Holds $0.20 After 8.7M PI Unlock, 19M KYC Milestone-What’s Next?
Pi Network price continues to trade just above the crucial $0.20 support, despite ongoing weakness…
- Price Analysis
XRP Price Prediction Ahead of US Strategic Crypto Reserve
As the year comes to an end, XRP price hovers near the $1.80 support level,…