XRP Price Analysis: Can 200-day EMA Breakdown Push Prices Below $0.5?
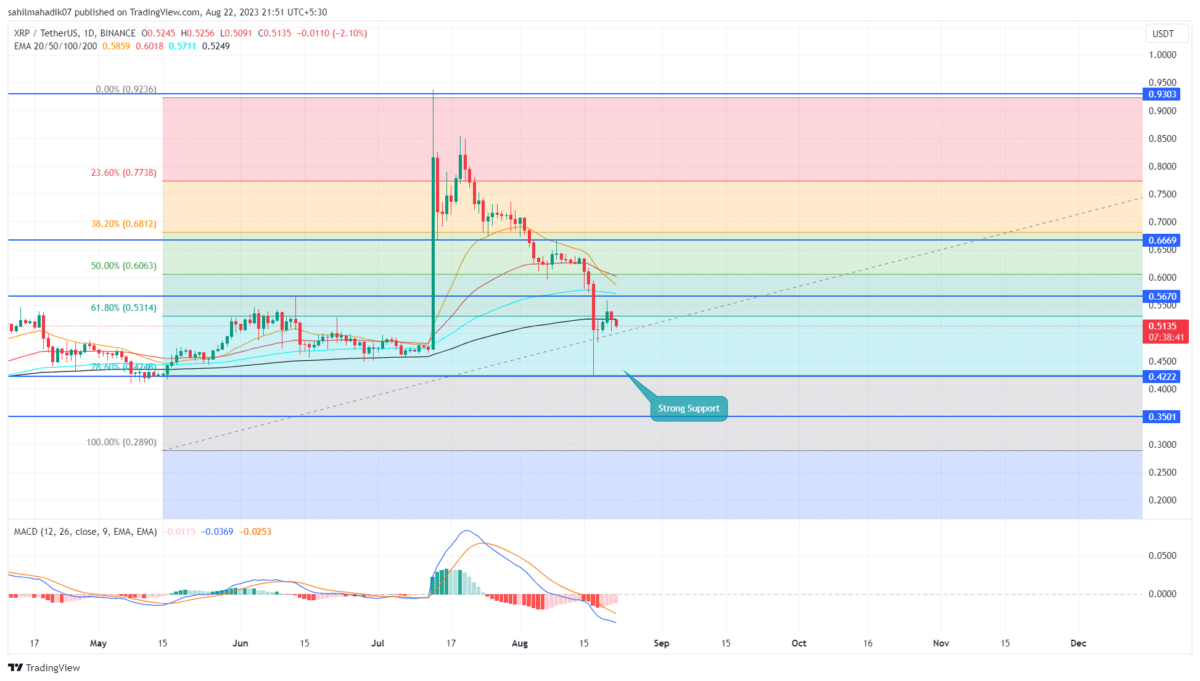
Amid the increasing bearishness in the crypto market, the XRP price witnessed a massive sell-off on August 17th, leading the correction trend to a low of $0.4226. Considering the high of $0.938, this downfall registered around a 54.5% loss in the last six weeks. Can the aforementioned support aligned with the 78.6% Fibonacci retracement level recuperate the bullish momentum?
Also Read: XRP Facing Bear vs Bull Showdown; Who Will Win
XRP Daily Chart: Key Points
- The XRP price can witness increasing demand pressure at $0.422
- The coin price below 200-day EMA projects a downtrend sentiment
- The intraday trading volume in the XRP is $1.08 Billion, indicating a 23% loss.
A keen look at the daily time frame chart shows the August 17th candle projects a long-tail rejection at the combined support at $0.422 and 78.6% FIB. This lower price rejection indicates accumulation at lower levels, leading to a minor pullback of 10%.
However, the price trend reverted immediately from a high of $0.5582, indicating the sellers continue to sell on a bullish bounce which is a common trait of an established downtrend. By the press time, the XRP price trades at $0.514 with an intraday loss of 2%.
With sustained selling, the coin price should drop another 17% to break the $0.422 support. This breakdown should continue the correction trend and push the prices to $0.35.
Will XRP Price Recovery Back to $0.668?
While the price action hints the XRP price may continue to lose more ground, the rising demand pressure at $0.422 can offer buyers an opportunity to counterattack. A potential upswing would get better confirmation of a bullish recovery if the buyers break above the August 17th high of $0.5948 high. The post-breakout rally would lead the price back to the $0.668 mark.
- Exponential Moving Average: A bearish crossover between the 20-and-100-day EMA may accelerate the selling pressure among traders.
- Moving Average Convergence Divergence: A significant gap between the MACD(blue) and signal(orange) in a bearish alignment reflects the downtrend sentiment.
Recent Posts
- Price Analysis
Will Solana Price Hit $150 as Mangocueticals Partners With Cube Group on $100M SOL Treasury?
Solana price remains a focal point as it responds to both institutional alignment and shifting…
- Price Analysis
SUI Price Forecast After Bitwise Filed for SUI ETF With U.S. SEC – Is $3 Next?
SUI price remains positioned at a critical intersection of regulatory positioning and technical structure. Recent…
- Price Analysis
Bitcoin Price Alarming Pattern Points to a Dip to $80k as $2.7b Options Expires Today
Bitcoin price rebounded by 3% today, Dec. 19, reaching a high of $87,960. This rise…
- Price Analysis
Dogecoin Price Prediction Points to $0.20 Rebound as Coinbase Launches Regulated DOGE Futures
Dogecoin price has gone back to the spotlight as it responds to the growing derivatives…
- Price Analysis
Pi Coin Price Prediction as Expert Warns Bitcoin May Hit $70k After BoJ Rate Hike
Pi Coin price rose by 1.05% today, Dec. 18, mirroring the performance of Bitcoin and…
- Price Analysis
Cardano Price Outlook: Will the NIGHT Token Demand Surge Trigger a Rebound?
Cardano price has entered a decisive phase as NIGHT token liquidity rotation intersects with structural…