XRP Price Analysis: Is $XRP Price Set to Break $0.5 this Week?
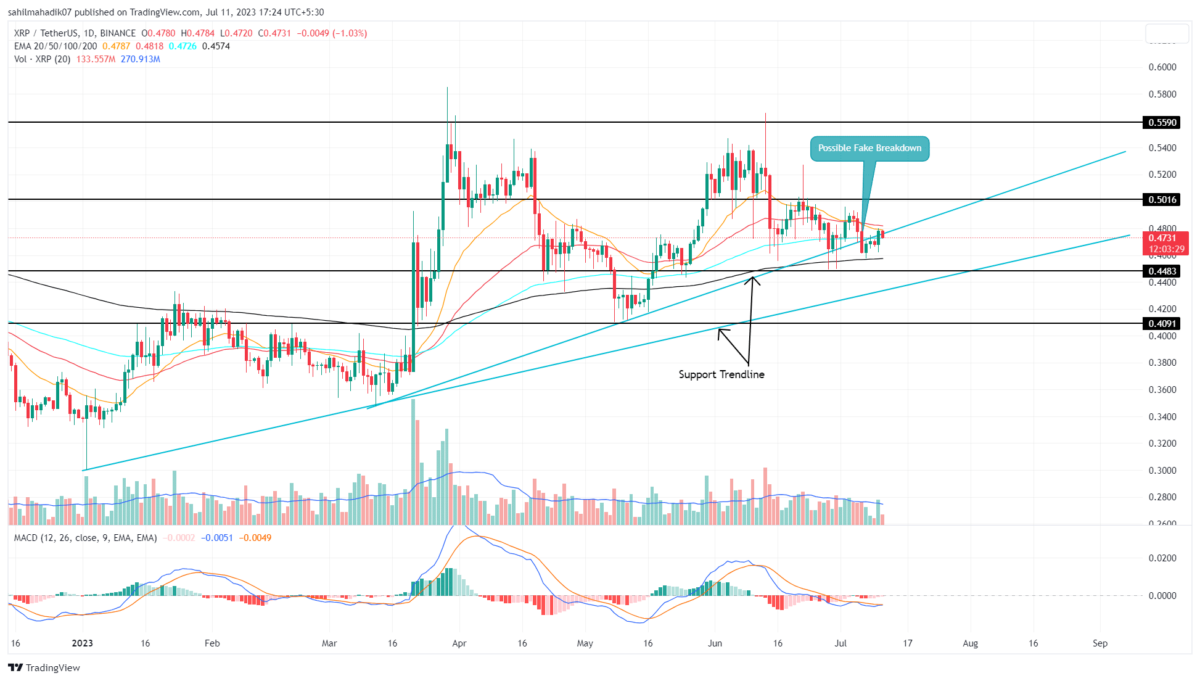
XRP Price Analysis: On July 6th, the XRP price gave a bearish breakdown from a significant support trendline, projecting a possibility of an upcoming correction. However, the price showcased no follow-up and has been moving sideways over the past five days. The inability of sellers to push the prices down despite given time indicates weakness in bearish momentum and the potential for buyers to regain trend control.
Also Read: Binance’s XRP, SHIB Balances Hit Impressive Highs
XRP Price Daily Chart:
- A fake breakdown from the support trendline sets the XRP price for a potential upswing
- The 200-day EMA slope offers strong support to XRP buyers
- The intraday trading volume in the XRP is $800.2 Million, indicating a 22.2% gain.
With the recent upswing in XRP price, the buyers try to reclaim the breached support of the ascending trendline. In this quest, the bulls would need to close a daily candle above the aforementioned trendline and the $0.482 high of the July 6th breakdown candle.
This development will signal the prior crackdown as a bear trap and increase the buying orders as short-sellers exit their position. Therefore, if buyers regain their higher ground, the XRP price is likely to rise again.
The post-breakout rally may push the $0.5 beyond the $0.55-0.56 ceiling. This barrier counts as a forbidden barrier for buyers for over a year.
Will XRP Price Retest $0.45?
The XRP coin remained an underperforming coin during the recent recovery rally in late June. Thus, if the crypto market shows uncertainty, the sellers could maintain the XRP price below the breached trendline. With sustained selling, the price could plunge 6.5% down to hit the next significant support trendline at $0.45
- Exponential Moving Average: With the anticipated breakout, the buyers will also regain daily EMAs(20, 50, and 100) providing more edge to long-buyers.
- Moving Average Convergence Divergence: The MACD(blue) and signal(orange) lines moving flat in a signal line indicate neutral sentiment among traders.
Recent Posts
- Price Analysis
Bitcoin and XRP Price At Risk As US Govt. Shutdown Odds Reach 73%
Bitcoin and XRP prices remained under pressure today, January 25, as investors anticipated a busy…
- Price Analysis
PEPE vs PENGUIN: Can Pengu Price Outperform Pepe Coin in 2026?
PEPE vs PENGUIN is gaining attention as one of the top meme coin battles to…
- Price Analysis
Binance Coin Price Outlook As Grayscale Files S-1 for BNB
Binance Coin price has remained stable above $890, despite recent market corrections. The cryptocurrency’s price…
- Price Analysis
Solana Price Prediction as SOL ETF Inflows Outpace BTC and ETH Together
Solana price remains steady above $127 following a week of consolidation, despite facing recent bearish…
- Price Analysis
Bitcoin and Gold Outlook 2026: Warsh, Rieder Gain Traction in Trump’s Fed Pick
Bitcoin and gold prices have diverged this year as demand for the latter has soared.…
- Price Analysis
PEPE Coin Price Eyes 45% Rebound as Buyers Regain Control on Spot Markets
PEPE Coin price prediction has reached the stage of definite phase as the price stabilized…