XRP Price Analysis: Should Enter $XRP at $0.65 Dip?


XRP Price Analysis: Struggling under high bearish pressure ever since the cool-off rally started off the SEC case, the XRP price continues to decline. With a 20% drop over the last two weeks, the Ripple coin price struggles to find a footing and make a bullish reversal. Retracing deeper into the bearish quicksand will prices manage a comeback or will it crumble below the $0.60 mark?
Also Read: XRP20 Presale Goes Live On Ethereum – The ‘Next Evolution’ Of XRP With Staking
XRP Price Daily Chart:
- The narrow range available within the chart pattern forms a no-trading zone.
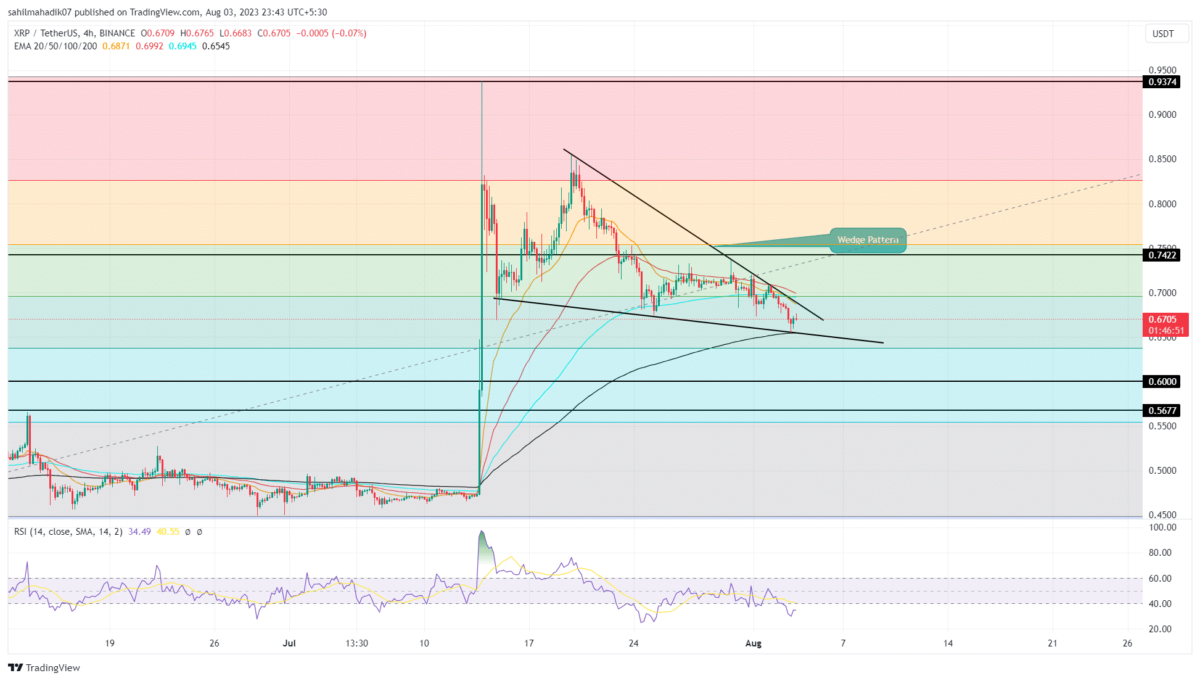
- The downsloping EMAs(20, 50, and 100) offer additional resistance amid the ongoing correction phase
- The intraday trading volume in the XRP is $1.33 Billion, indicating a 7.6% gain.
 Source: Tradingview
The XRP coin price has been following a downward trend, forming a falling wedge pattern in the four-hour chart. Recently, it experienced a significant 20% drop in value over the last two weeks, bringing the price below the $0.70 mark.
Currently, the XRP price is moving away from the resistance trend line, resulting in a 5.79% drop in the last 24 hours. On the other hand, the four-hour chart shows that buyers are rejecting lower prices, indicating their acceptance despite the selling pressure.
According to the Fibonacci retracement level, the coin price finds support at the 61.8% level and the 200 EMA at $0.65.
[converter id=”xrp-xrp” url=”https://coingape.com/price/converter/xrp-to-usd/?amount=1″]
What’s Next for XRP Price?
If XRP manages to surpass the overhead supply at $0.69, it could lead to a bullish breakout, possibly reaching the $0.80 mark. However, if it breaks down below the 50% support level at $0.65, it may lead to a market decline and test the bullish dominance at $0.60 psychological support
- Exponential Moving Average: The declining 50 EMA projects the possibility of a death cross with the 200 EMA in the four-hour chart.
- Relative Strength Index: The RSI indicator shows a positive divergence within the wedge pattern, increasing the likelihood of a bullish reversal leading to an upward breakout.

Why Trust CoinGape
CoinGape has covered the cryptocurrency industry since 2017, aiming to provide informative insights Read more…to our readers. Our journal analysts bring years of experience in market analysis and blockchain technology to ensure factual accuracy and balanced reporting. By following our Editorial Policy, our writers verify every source, fact-check each story, rely on reputable sources, and attribute quotes and media correctly. We also follow a rigorous Review Methodology when evaluating exchanges and tools. From emerging blockchain projects and coin launches to industry events and technical developments, we cover all facets of the digital asset space with unwavering commitment to timely, relevant information.

Related Articles


- Jane Street and Abu Dhabi Wealth Fund Mubadala Increase Holdings In BlackRock’s Bitcoin ETF
- FOMC Minutes Drop Tomorrow: Will Crypto Market Rally or Face Fed Shock?
- BlackRock Amends Filing For Staked Ethereum ETF, Eyes 18% of Staking Rewards From ETH Fund
- Arizona Advances Bitcoin, XRP Reserve Bill Using Seized Crypto Assets
- Bitcoin ETF Update: BlackRock Signals BTC Sell-Off as Kevin O’Leary Warns of Decline In Institutional Demand
- Pi Network Price Beats Bitcoin, Ethereum, XRP as Upgrades and Potential CEX Listing Fuels Demand
- 5 Things Dogecoin Price Needs to Hit $0.20 in Feb 2026
- Bitcoin Price Prediction as Experts Warns of Quantum Risks
- Dogecoin, Shiba Inu, Pepe Coin Price Predictions As BTC Crashes Below $68k
- Ethereum Price Outlook as Harvard Shifts Focus from Bitcoin to ETH ETF
- HOOD and COIN Stock Price Forecast as Expert Predicts Bitcoin Price Crash to $10k


