XRP Price Analysis: Will FOMO Drive $XRP Price Above $1?


XRP Price Analysis: On July 13th, the 4th largest cryptocurrency-XRP recorded a massive gain of 73% as Ripple acquired partial victory in its long-standing legal battle against the Securities and Exchange Commission (SEC). The bullish rally has topped $0.938 and reflected a significant supply zone near $0.9118. The build-up selling pressure has triggered a post-rally correction meant to replenish the exhausted bullish momentum.
Also Read: Ripple CTO Regrets This Following XRP Lawsuit Ruling
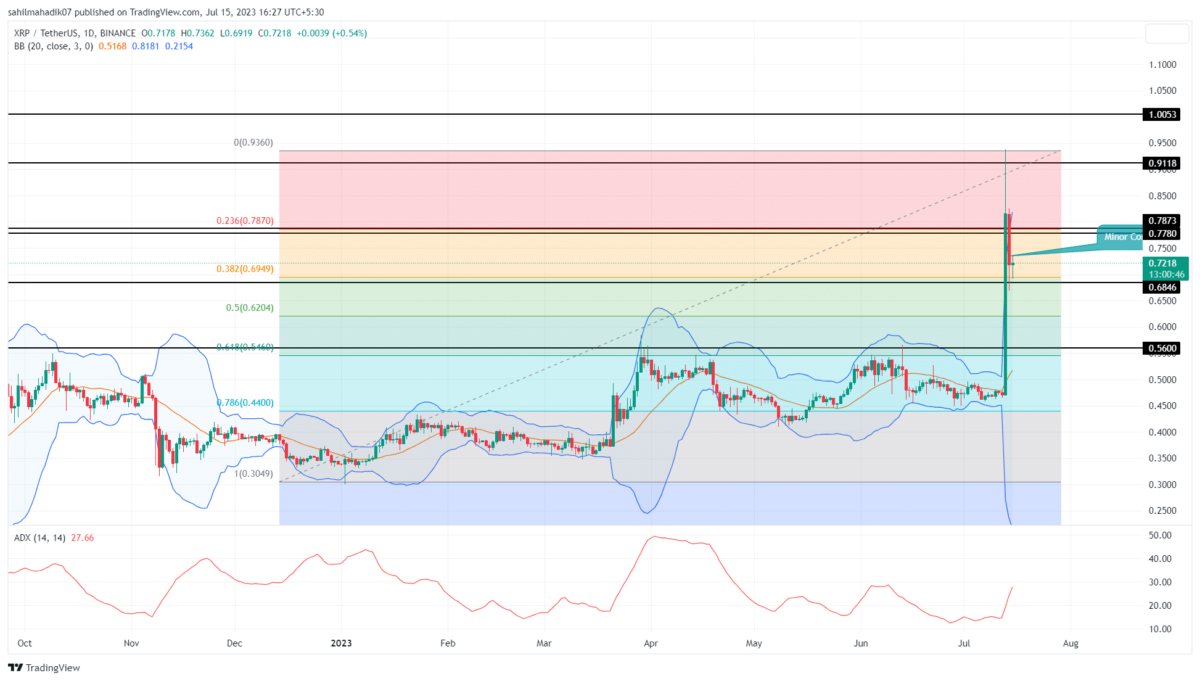
XRP Price Daily Chart:
- The lower price rejection candle near the $0.685 level indicates the buyers are obtaining strong support from here
- A breakdown from $0.685 support could trigger a quick 10% drop
- The intraday trading volume in the XRP is $5.4 Billion, indicating a 59% loss.
 Source: Tradingview
After a reversal from $0.9118 resistance, the XRP price entered a correction mode and plunged 25% to retest the local support of $0.685. This pullback is likely the result of short-term traders securing their profits by exiting long positions.
As of now, altcoin trades at $0.723 and projects sustainability above the $0.685 support with lower price rejection candles. This horizontal level aligned with the 38.2% Fibonacci retracement level creates a strong footing for buyers to recuperate bullish momentum.
This support would assist the buyer to hold the higher grounds and lead the prices sideways for a short period. Having said that, a rapid breakout above $1 is less likely with other supportive news as the price has already traveled significantly.
[converter id=”xrp-xrp” url=”https://coingape.com/price/converter/xrp-to-usd/?amount=1″]
How Far May XRP Price Correct?
In case, the crypto market experienced a higher correction, a breakdown below $0.685 support would lead the XRP price to 10% down to hit $0.62 aligned with a 50% retracement level. Any further retracement would start to reflect weakness in buyers’ conviction.
- Bollinger Band: The coin price hitting the 3rd deviation upper band of the Bollinger Band indicator suggests instability in the current trend and the need for correction.
- Average Directional Index: The daily ADX slope uptick near 27% indicates strength in buyers to sustain a bullish trend

Why Trust CoinGape
CoinGape has covered the cryptocurrency industry since 2017, aiming to provide informative insights Read more…to our readers. Our journal analysts bring years of experience in market analysis and blockchain technology to ensure factual accuracy and balanced reporting. By following our Editorial Policy, our writers verify every source, fact-check each story, rely on reputable sources, and attribute quotes and media correctly. We also follow a rigorous Review Methodology when evaluating exchanges and tools. From emerging blockchain projects and coin launches to industry events and technical developments, we cover all facets of the digital asset space with unwavering commitment to timely, relevant information.