XRP Price Analysis: Will $0.45 Support Hold Amidst Intensifying Selling Pressure?


XRP Price Analysis: On June 6th, the XRP price gave a bearish breakdown from the support trendline which carried a steady recovery for nearly four months. The downfall signals a change in market sentiment and the possibility of a downtrend continuation to $0.42. Is the XRP price poised for a massive correction or there’s a hope for buyers to reclaim higher ground?
Also Read: Bank Of America Praises Ripple’s Cross-Border Payments
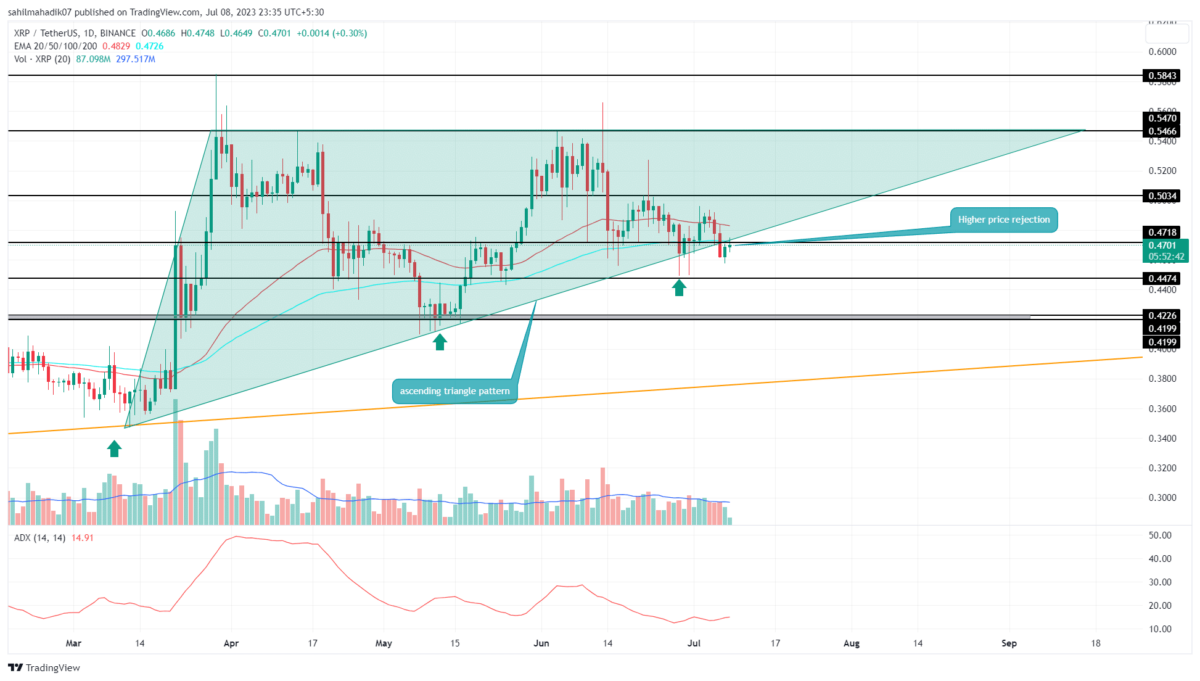
XRP Price Daily Chart:
- Triangle pattern breakdown intensifies the supply pressure on XRP price.
- A daily candle with higher price rejection project overhead selling pressure is active
- The intraday trading volume in the XRP is $414.5 Million, indicating a 43.3% loss.
 Source- Tradingview
Failing to rise above the $0.54 multiple-month resistance, the XRP coin prices crossed below the crucial support trendline leading to a recovery trend from Mid-March. With a 14% fall in the last month, the altcoin has come closer to the crucial psychological support level of $0.45.
The crackdown of the support trendline line nullifies the formation of an ascending triangle pattern in the daily chart. Thus the bearish conclusion of a bullish pattern is rare a reflects the aggressive nature of sellers.,
Currently trading at $0.4675 ripple prices shows a short bullish relief from the 200-day EMA. This last-minute support of these EMAs could be buyers’ final push to reclaim trend control. A price jump back above the support trendline will invalidate the bullish thesis and pave the way for fresh recovery.
Will the XRP Price lose $0.45 Mark?
With an intraday gain of 0.34%, it retested the breached trendline of the triangle pattern. A long-wick rejection attached to the daily candle indicates the sellers are defending the new resistance which could lead to a continuation of the downtrend. The interested trades can take short-sell entries at this price and wait for a safer entry below the 200-day EMA. The potential downfall may plunge the prices back to $0.42.
- Exponential Moving Average: The daily EMAs(20, 50, and 100) above the coin price could exert additional selling pressure against buyers.
- Average Directional Index: An uptick in the daily ADX for falling prices indicates strength in market sellers.

Why Trust CoinGape
CoinGape has covered the cryptocurrency industry since 2017, aiming to provide informative insights Read more…to our readers. Our journal analysts bring years of experience in market analysis and blockchain technology to ensure factual accuracy and balanced reporting. By following our Editorial Policy, our writers verify every source, fact-check each story, rely on reputable sources, and attribute quotes and media correctly. We also follow a rigorous Review Methodology when evaluating exchanges and tools. From emerging blockchain projects and coin launches to industry events and technical developments, we cover all facets of the digital asset space with unwavering commitment to timely, relevant information.

Related Articles


- Jane Street and Abu Dhabi Wealth Fund Mubadala Increase Holdings In BlackRock’s Bitcoin ETF
- FOMC Minutes Drop Tomorrow: Will Crypto Market Rally or Face Fed Shock?
- BlackRock Amends Filing For Staked Ethereum ETF, Eyes 18% of Staking Rewards From ETH Fund
- Arizona Advances Bitcoin, XRP Reserve Bill Using Seized Crypto Assets
- Bitcoin ETF Update: BlackRock Signals BTC Sell-Off as Kevin O’Leary Warns of Decline In Institutional Demand
- Pi Network Price Beats Bitcoin, Ethereum, XRP as Upgrades and Potential CEX Listing Fuels Demand
- 5 Things Dogecoin Price Needs to Hit $0.20 in Feb 2026
- Bitcoin Price Prediction as Experts Warns of Quantum Risks
- Dogecoin, Shiba Inu, Pepe Coin Price Predictions As BTC Crashes Below $68k
- Ethereum Price Outlook as Harvard Shifts Focus from Bitcoin to ETH ETF
- HOOD and COIN Stock Price Forecast as Expert Predicts Bitcoin Price Crash to $10k


