XRP Price Analysis: Will $0.45 Support Hold Amidst Intensifying Selling Pressure?
XRP Price Analysis: On June 6th, the XRP price gave a bearish breakdown from the support trendline which carried a steady recovery for nearly four months. The downfall signals a change in market sentiment and the possibility of a downtrend continuation to $0.42. Is the XRP price poised for a massive correction or there’s a hope for buyers to reclaim higher ground?
Also Read: Bank Of America Praises Ripple’s Cross-Border Payments
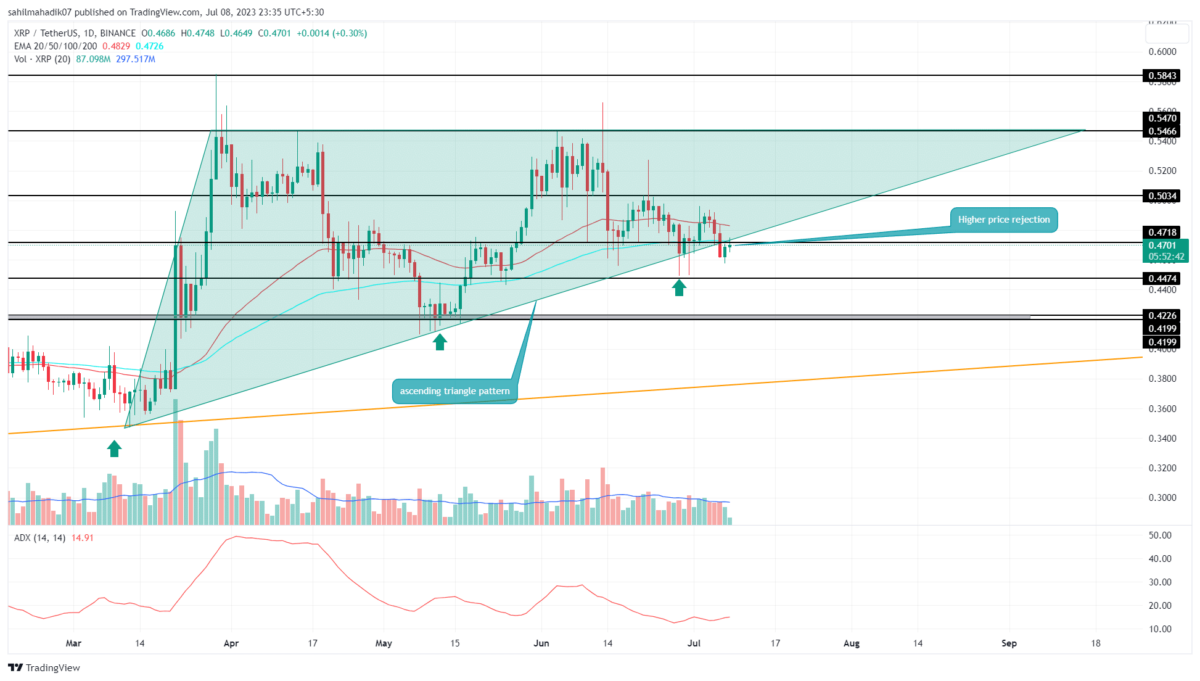
XRP Price Daily Chart:
- Triangle pattern breakdown intensifies the supply pressure on XRP price.
- A daily candle with higher price rejection project overhead selling pressure is active
- The intraday trading volume in the XRP is $414.5 Million, indicating a 43.3% loss.
Failing to rise above the $0.54 multiple-month resistance, the XRP coin prices crossed below the crucial support trendline leading to a recovery trend from Mid-March. With a 14% fall in the last month, the altcoin has come closer to the crucial psychological support level of $0.45.
The crackdown of the support trendline line nullifies the formation of an ascending triangle pattern in the daily chart. Thus the bearish conclusion of a bullish pattern is rare a reflects the aggressive nature of sellers.,
Currently trading at $0.4675 ripple prices shows a short bullish relief from the 200-day EMA. This last-minute support of these EMAs could be buyers’ final push to reclaim trend control. A price jump back above the support trendline will invalidate the bullish thesis and pave the way for fresh recovery.
Will the XRP Price lose $0.45 Mark?
With an intraday gain of 0.34%, it retested the breached trendline of the triangle pattern. A long-wick rejection attached to the daily candle indicates the sellers are defending the new resistance which could lead to a continuation of the downtrend. The interested trades can take short-sell entries at this price and wait for a safer entry below the 200-day EMA. The potential downfall may plunge the prices back to $0.42.
- Exponential Moving Average: The daily EMAs(20, 50, and 100) above the coin price could exert additional selling pressure against buyers.
- Average Directional Index: An uptick in the daily ADX for falling prices indicates strength in market sellers.
Recent Posts
- Price Analysis
Will Bitcoin Price Hit $100k Before Year-End? Prediction and Analysis
Bitcoin price moves into the final trading sessions with uncertainty around upside continuation. BTC price…
- Price Analysis
Bitcoin Price Prediction As Michael Saylor Pauses BTC Purchase- Is A Fall to $74k Imminent?
Michael Saylor's Strategy has paused additional BTC purchases while increasing cash reserves, prompting renewed speculation…
- Price Analysis
Aster launched Phase 5 Buyback Program Allocating 80% Fees. Will ASTER Price Rally?
Aster price hovered above $0.70 following a 2.67% daily gain, supported by a bullish market…
- Price Analysis
XRP Price Prediction: Rare Bullish Patterns Align With Powerful Catalysts
The XRP price has stabilized in the past few days as it jumped by ~9%…
- Price Analysis
Weekly Crypto Price Prediction: Bitcoin, Ethereum, and XRP as Market Momentum Builds
As Christmas week begins, the crypto market shows early signs of recovery. Over the past…
- Price Analysis
Will Solana Price Hit $150 as Mangocueticals Partners With Cube Group on $100M SOL Treasury?
Solana price remains a focal point as it responds to both institutional alignment and shifting…