XRP Price Heading to $0.6; Is this Dip Worth Buying?


On July 13th, the Ripple coin price experienced an impressive surge of 73% due to a partial victory in the SEC lawsuit, reaching a peak of $0.82. However, after this partial triumph, XRP struggled to keep up the upward momentum, resulting in a double top formation at the $0.82 level and a neckline at $0.70. A recent breakdown from this support triggered extended correction for this altcoin.
Also Read: Ripple Joins Top Global Derivatives Trade Body IDSA
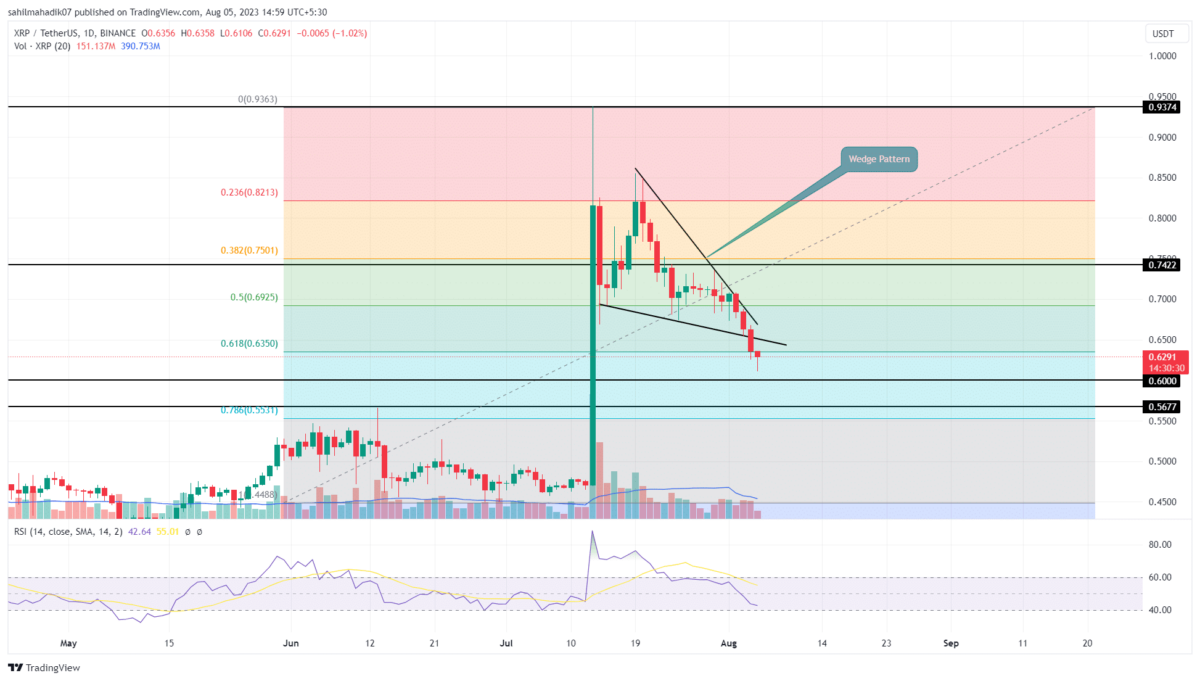
XRP Price Daily Chart:
- A breakdown below the wedge pattern support sets the XRP price for a 15% drop
- The 20-day EMA slope may flip into a suitable resistance
- The intraday trading volume in the XRP is $1.4 Billion, indicating a 17% gain.
 Source: Tradingview
The declining XRP prices have formed a bearish wedge pattern on the daily chart. After several days of stability at $0.70, intense selling pressure at the resistance trendline triggered a significant drop in Ripple’s market value.
This downturn represents a 12% decrease over the past four days, with four successive bearish candles. This significant reduction in this altcoin price resulted in the break of the falling wedge pattern and the 38.20% Fibonacci level at $0.64.
At present, the XRP market price is having difficulty maintaining above the 50-day EMA. However, the increase in selling pressure suggests a continued downtrend to the 78.6% Fibonacci level at $0.53. Interestingly, a support zone aligns with this 61.80% fib level, which could increase the chances of a bullish resurgence.
[converter id=”xrp-xrp” url=”https://coingape.com/price/converter/xrp-to-usd/?amount=1″]
XRP Price to $0.53?
The XRP coin price is anticipated to continue its downward trend, potentially reducing the market value by 15%. However, a bullish turnaround from the 50-day EMA could lead to a retest of the bearish wedge breakout at $0.64. If the coin price shows sustainability below this level, the potential short sellers can enter for a downfall to $0.53.
- Bollinger Band: A downsloping lower band of Bollinger band indicators reflects high momentum selling in the XRP price.
- Relative Strength Index: The falling RSI slope breaks below the midpoint indicating strong underlying bearish momentum

Why Trust CoinGape
CoinGape has covered the cryptocurrency industry since 2017, aiming to provide informative insights Read more…to our readers. Our journal analysts bring years of experience in market analysis and blockchain technology to ensure factual accuracy and balanced reporting. By following our Editorial Policy, our writers verify every source, fact-check each story, rely on reputable sources, and attribute quotes and media correctly. We also follow a rigorous Review Methodology when evaluating exchanges and tools. From emerging blockchain projects and coin launches to industry events and technical developments, we cover all facets of the digital asset space with unwavering commitment to timely, relevant information.
Related Articles


- Trump’s World Liberty Faces House Probe Amid Claims of Major UAE Investment
- Bitmine ETH Position Bleeds Billions As Ethereum Struggles to Hold $2k
- Crypto Market Crash Deepens as Bitcoin Falls to $70K amid Bear Market Jitters
- CLARITY Act: Crypto Firms Propose New Changes to Advance Stalled Market Bill
- Binance Denies Fake Cease-and-Desist Claim Amid Bankruptcy Rumors
- Why XRP Price Struggles With Recovery?
- Dogecoin Price Prediction After SpaceX Dogecoin-Funded Mission Launch in 2027
- Solana Price Crashes Below $95 for the First Time Since 2024: How Low Will SOL Go Next?
- Ethereum Price Eyes a Rebound to $3,000 as Vitalik Buterin Issues a Warning on Layer-2s
- Pi Network Price Outlook as Bitcoin Faces a Strong Sell-Off Below $80k
- Bitcoin Price Prediction As US House Passes Government Funding Bill to End Shutdown


