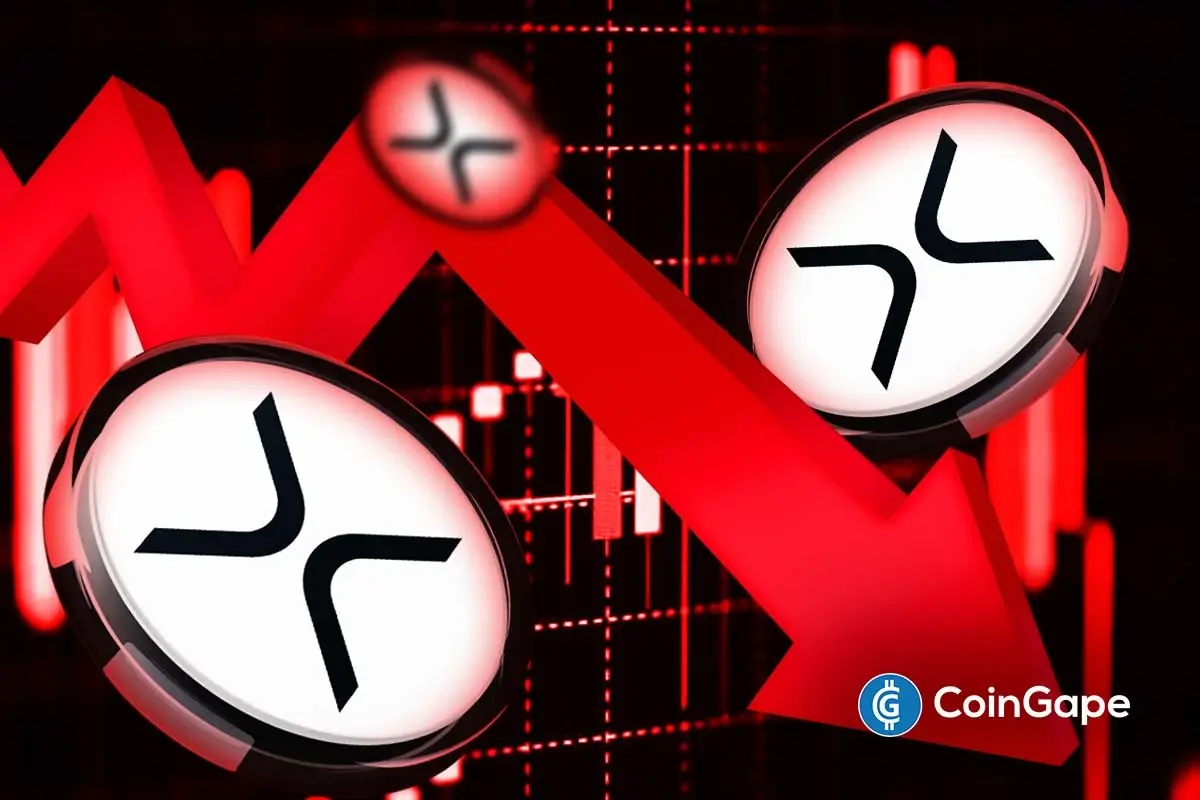
XRP Price Outlook: Bears Target $1.60 as 90-day MVRV Signals Top


Highlights
- XRP price faces a potential 26% crash to $1.63 after a breakdown from a bear flag pattern.
- The 90-day MVRV has also surged to an overheated zone that may cause a surge in profit-taking.
- However, the MFI is rising and stands at 56 suggesting that the bear flag breakdown could be a bear trap and a bullish reversal is likely.
XRP price is up by a modest 1% today, June 14, as the volatility that rocked crypto prices on Friday due to the Israel-Iran conflict waned. At press time, XRP trades at $2.16 with $2.3 billion daily trading volumes, signalling high market interest. However, the appearance of a bear flag pattern on the daily timeframe suggests that the price could plunge to $1.60, while a key on-chain metric hints towards the formation of a local top.
XRP Price Outlook as Bear Flag Breakout Signals $1.60 Drop
The daily timeframe chart for XRP price shows a bearish breakdown from a bear flag pattern. By losing support from the lower trendline of the flag’s parallel channel, XRP may now be poised for a steep decline below the psychological support level of $2. The breakdown also signals that the downtrend that commenced in mid-May could continue.
The temporary pause that created the flag’s ascending channel was caused by late buyers who missed the April-May bull run. If demand towards Ripple dries up even with recent developments in the Ripple vs. SEC lawsuit, a downward continuation could commence as bears seek to book profits due to uncertainty.
The breakdown could result in a 26% crash to $1.63 based on the flagpole’s height. Moreover, as XRP price lost the lower trendline support, sell-side volumes spiked to $172 million, the highest since May 30, as sellers flocked to the market.
Meanwhile, the Directional Movement Index (DMI) amplifies the bearish outlook as the -DI oscillates above the +DI. This indicates that the downward price movements are stronger than the upward movements, reinforcing the thesis that Ripple’s price may drop to $1.60.
This bearish outlook aligns with a recent CoinGape analysis noting that on the lower 4-hour timeframe, XRP hints at a drop below $2 as whales also begin to sell.
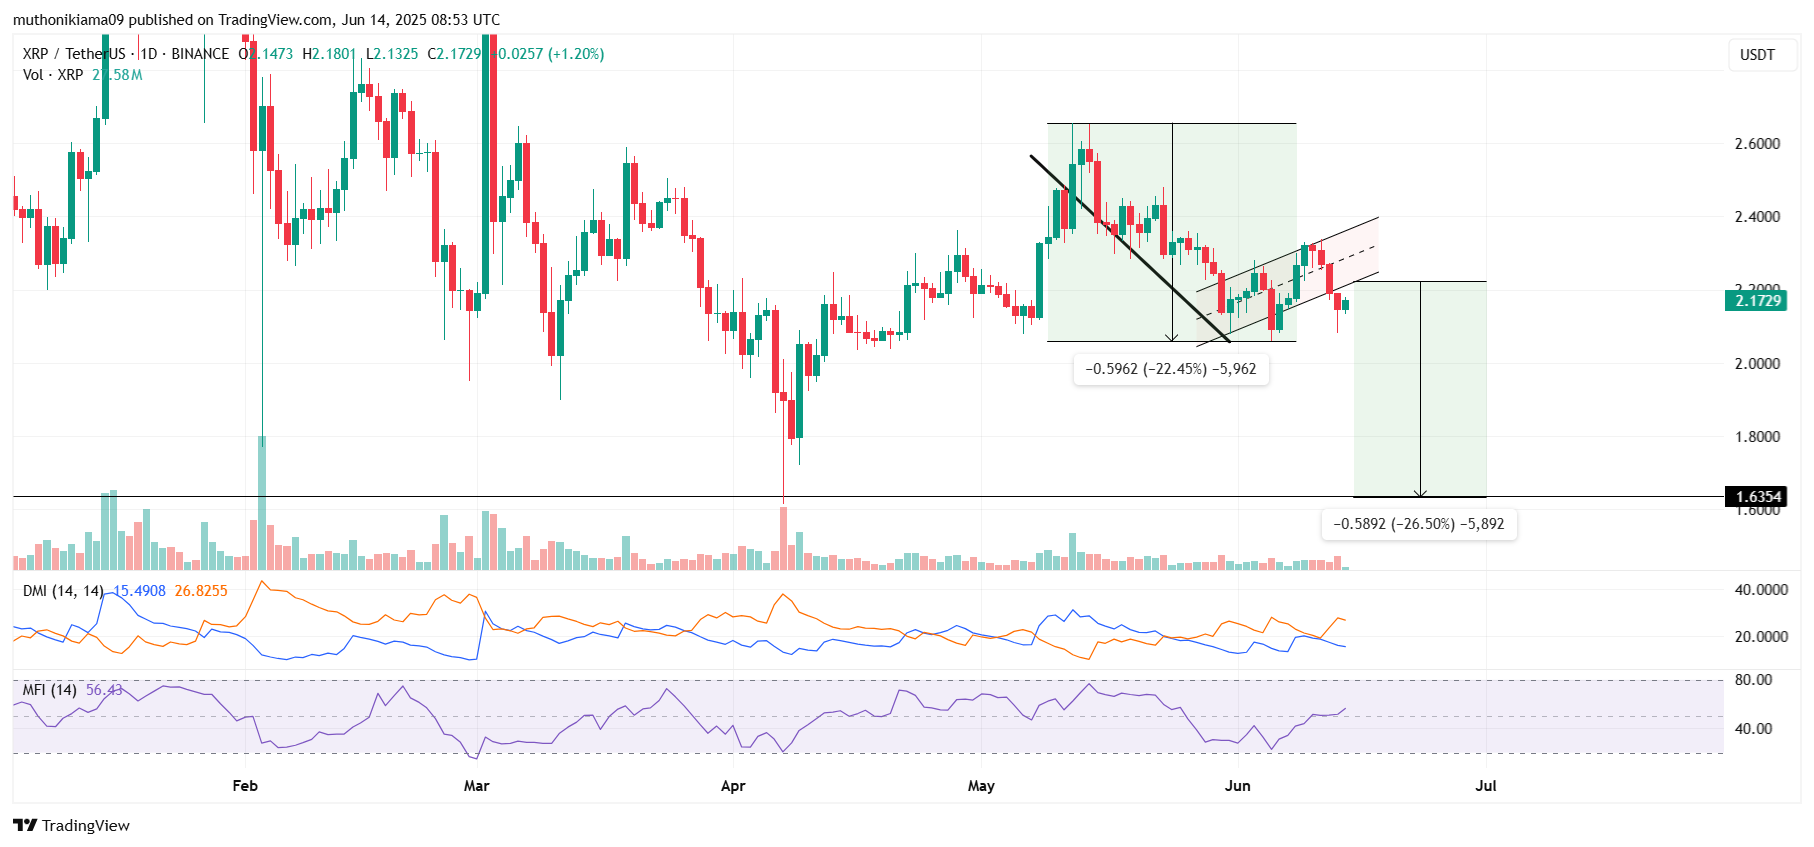
Conversely, the MFI indicator is rising and stands at 56. This suggests that the flag pattern’s breakdown could be a bear trap, and XRP price could reclaim the lower trendline as support. One of the bullish catalysts that could aid a reversal includes Ripple’s RLUSD growth ahead of the GENIUS Act vote on June 14.
90-day MVRV Signals Local Top
The 90-day Market Value to Realized Value (MVRV) signals that XRP price may have formed a local top. Per Santiment’s data, this metric has surged to 31%, indicating that the traders who purchased in the last 30 days are sitting on profits of 31%.
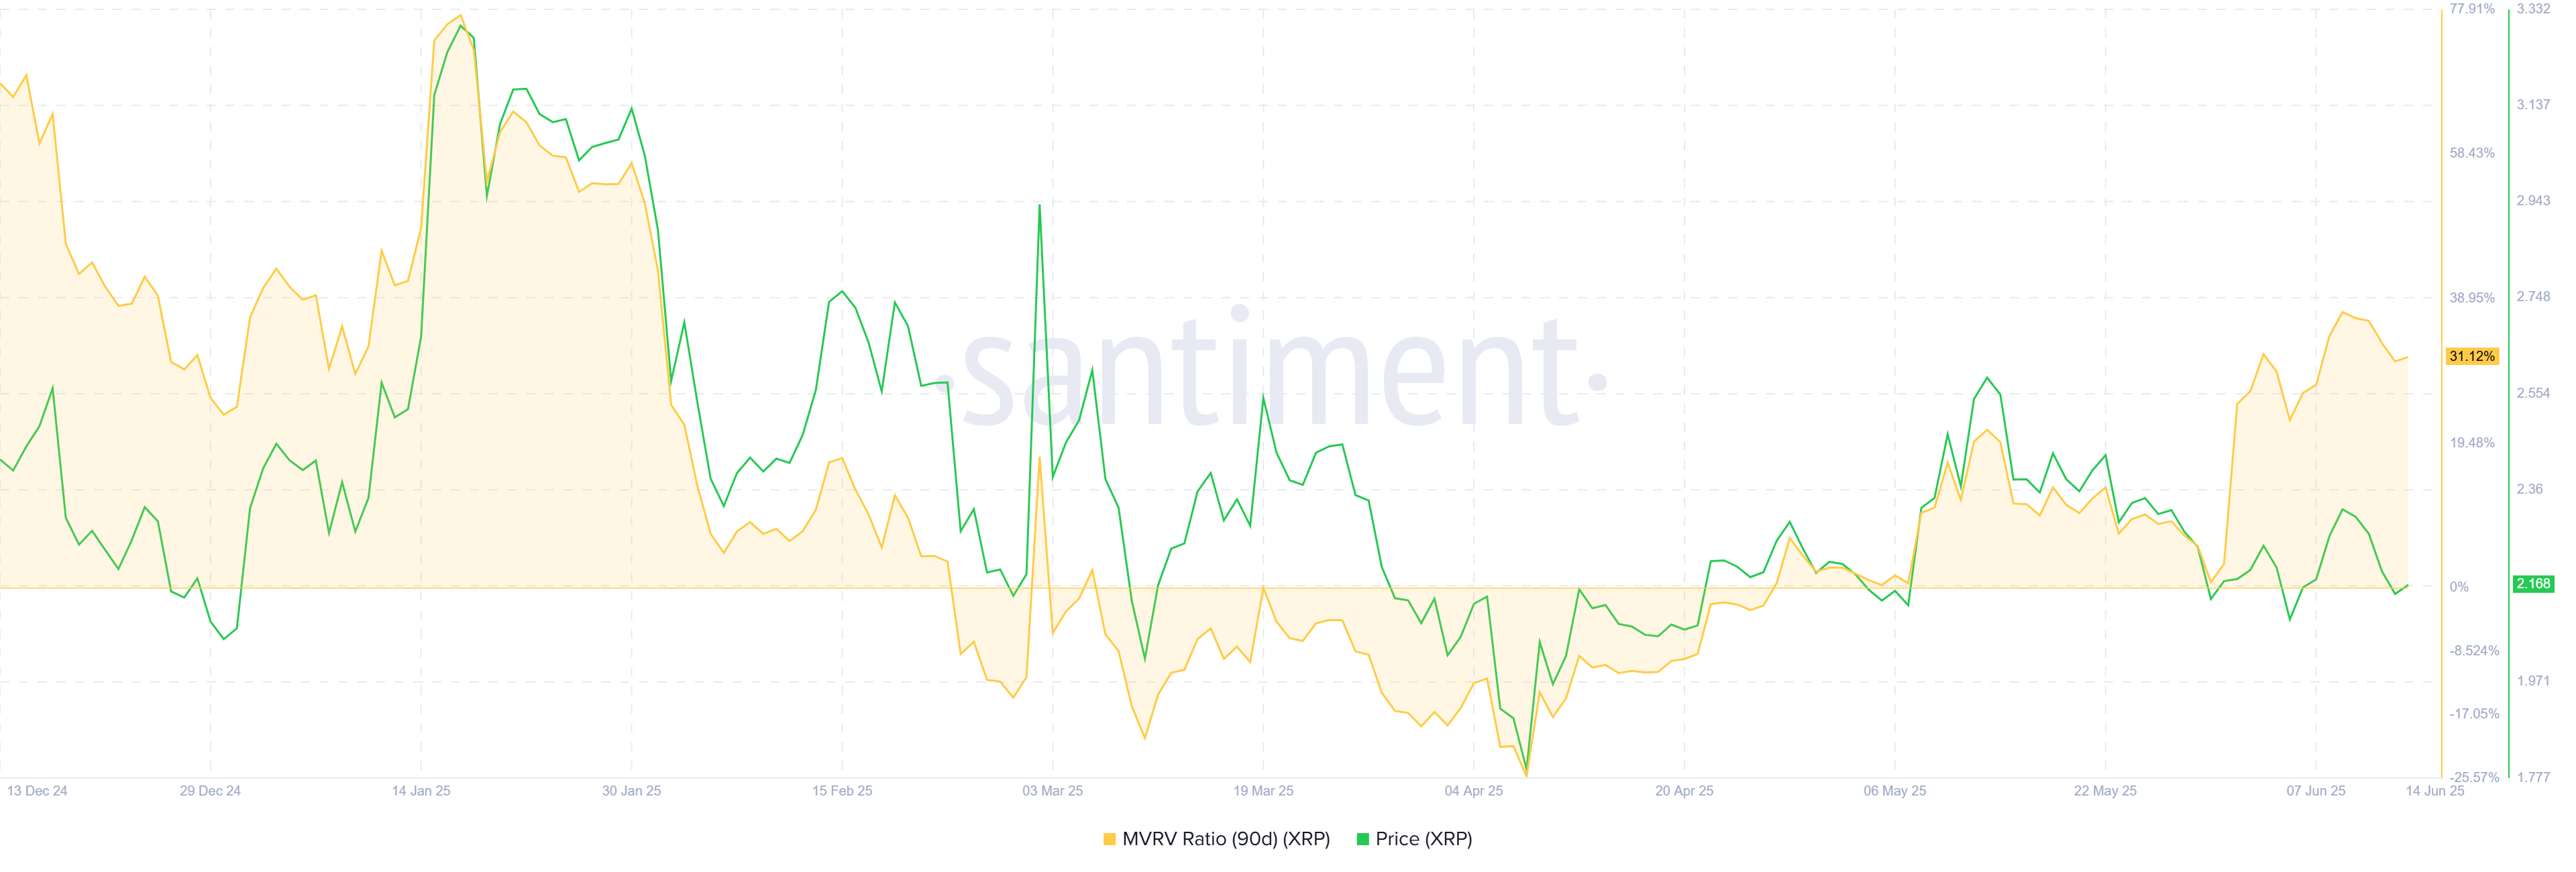
When many recent buyers are in profit, it increases the likelihood of profit-taking activity. The possibility of this happening is even higher because at its current level, Ripple’s MVRV is in an overheated zone that has preceded a correction. Looking at past trends, each time Ripple’s MVRV reached levels above 15, a bearish reversal ensued shortly after.
In summary, the downside risk towards XRP price has increased as it confirms a bearish breakdown from a bear flag pattern. If a 26% crash ensues as depicted by the flagpole’s height, Ripple could plunge to $1.63. The MVRV ratio, currently at an overheated zone, also supports the likelihood of a bearish reversal as traders become more likely to take profits.
Frequently Asked Questions (FAQs)
1. Can XRP price fall below $2?
2. Which bullish catalysts could aid Ripple’s price reversal?
3. Why is the 90-day MVRV bearish for Ripple’s price?

Why Trust CoinGape
CoinGape has covered the cryptocurrency industry since 2017, aiming to provide informative insights Read more…to our readers. Our journal analysts bring years of experience in market analysis and blockchain technology to ensure factual accuracy and balanced reporting. By following our Editorial Policy, our writers verify every source, fact-check each story, rely on reputable sources, and attribute quotes and media correctly. We also follow a rigorous Review Methodology when evaluating exchanges and tools. From emerging blockchain projects and coin launches to industry events and technical developments, we cover all facets of the digital asset space with unwavering commitment to timely, relevant information.
24 Hours volume
$1.73B
Market Cap
$81.91B
Max Supply
100B