XRP Price Prediction: Bearish Pressure Upon Pennant May Lead $XRP Under $0.50


Over the past two months, XRP price has been on a notable downward trajectory. This downtrend has been particularly significant, resulting in Ripple losing nearly 73% of its gains. These gains had been previously accrued during its partial victory against the SEC. Unfortunately, the subsequent period witnessed a reversal of fortunes, with the coin retracing most of these gains. Plunging back to the psychological mark of $0.50, will XRP make a comeback to $1?
Also Read: Ripple Joins Hands With Elon Musk’s SpaceX Partner In XRP Project
Pennant Breakout Might Plunge XRP
- The pennant pattern formation signals a downtrend continuation for XRP traders.
- A bullish breakout above the triangle pattern may trigger a significant upswing in XRP price.
- The intraday trading volume in the XRP is $496 Million, indicating a 32.56% loss.
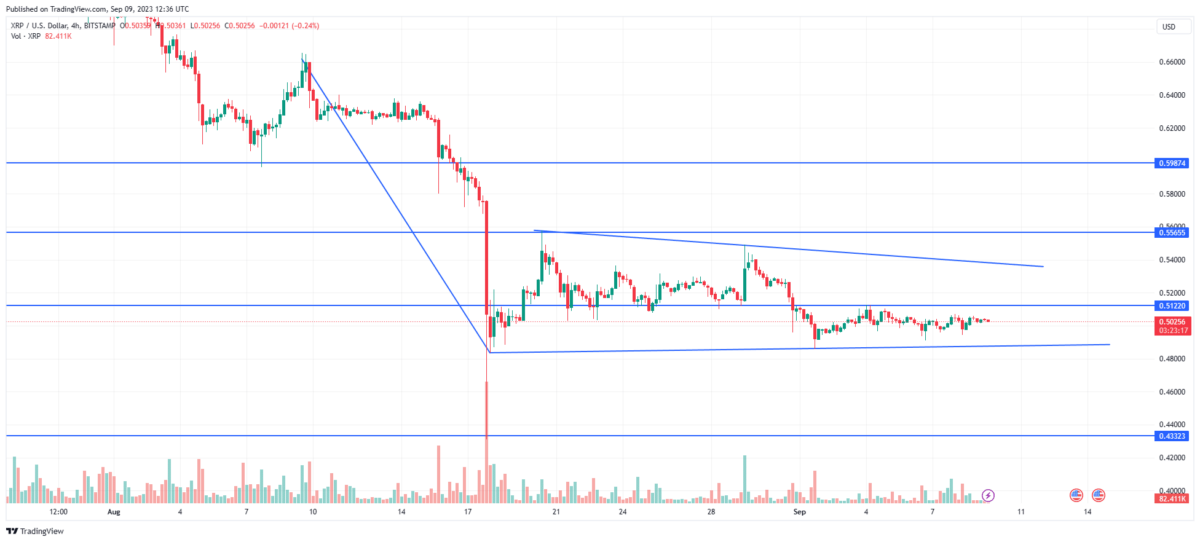
 Source: Tradingview
A bearish pennant pattern is becoming discernible when diving deeper into the XRP price action, particularly in the 4-hour chart. This pattern typically signals a continuation of the prevailing trend, which is bearish in Ripple’s case. The formation of this pattern amidst a downward trend often rings alarm bells for traders as it can indicate further losses on the horizon.
The XRP price demonstrates sideways movement despite the bearish undertones, oscillating between two critical levels. The overhead resistance stands firm at $0.51, while a support trend line demarcates the lower boundary.
As the price inches closer to this support trend line, the possibility of an upward movement towards the overhead resistance becomes apparent. Breaching the $0.51 resistance could pave the way for a more bullish outlook in the near term.
[converter id=”xrp-xrp” url=”https://coingape.com/price/converter/xrp-to-usd/?amount=1″]
Can the XRP Price Fall Back to $0.43?
If XRP price manages to rally past the $0.51 resistance, the coin might find itself challenging the overhead resistance trend line, potentially ushering in a bullish phase. On the contrary, a downward breakdown from the current sideways movement could spell trouble. Such a move would likely lead to the XRP price plunging towards the $0.43 mark, reaffirming the bearish sentiment and potentially leading to further losses.
- Exponential Moving Average: The declining trend in 50-day EMA warns of a death cross with 200-day EMA
- Relative Strength Index: The RSI slope reflects the underlying buying pressure is rising.

Why Trust CoinGape
CoinGape has covered the cryptocurrency industry since 2017, aiming to provide informative insights Read more…to our readers. Our journal analysts bring years of experience in market analysis and blockchain technology to ensure factual accuracy and balanced reporting. By following our Editorial Policy, our writers verify every source, fact-check each story, rely on reputable sources, and attribute quotes and media correctly. We also follow a rigorous Review Methodology when evaluating exchanges and tools. From emerging blockchain projects and coin launches to industry events and technical developments, we cover all facets of the digital asset space with unwavering commitment to timely, relevant information.
Related Articles


- Breaking: Tom Lee’s Bitmine Acquires 40,302 ETH as Whales Double Down On Ethereum
- BlackRock Files S-1 for Bitcoin Premium Income ETF as Crypto ETPs See $1.73B in Outflows
- Breaking: Michael Saylor’s Strategy Adds 2,932 BTC as Bitcoin Erases YTD Gains
- Binance Coin Gains Institutional Boost as Virtune Lists New BNB ETP on Nasdaq
- Bitget TradFi Review: Fees, Features, Security & Pros and Cons (2026)
- Bitcoin Price Prediction As Gold Breaks All-Time High
- Bitcoin and XRP Price At Risk As US Govt. Shutdown Odds Reach 73%
- PEPE vs PENGUIN: Can Pengu Price Outperform Pepe Coin in 2026?
- Binance Coin Price Outlook As Grayscale Files S-1 for BNB
- Solana Price Prediction as SOL ETF Inflows Outpace BTC and ETH Together
- Bitcoin and Gold Outlook 2026: Warsh, Rieder Gain Traction in Trump’s Fed Pick


