
XRP Price Prediction: Sellers Dominate $XRP And Warns A Crash With This 5% Drop!


XRP Price Prediction: Driving a bounce-back rally with increasing momentum, the buyers test the overhead resistance trendline. However, the higher price rejection with the market-wide setback pulls back the XRP price under $0.65. This warns of a deeper correction. Will Ripple Labs manage to swim against the market-wide correction or is it falling under $0.60 this time?
Is XRP Crashing Below $0.60?
- The XRP price shows a sharp reversal from the resistance trendline as sellers delay a bullish break.
- The 5% drop with long tail formation teases a consolidation range.
- The intraday trading volume in Ripple is $1.843 Billion, indicating a 17% gain.
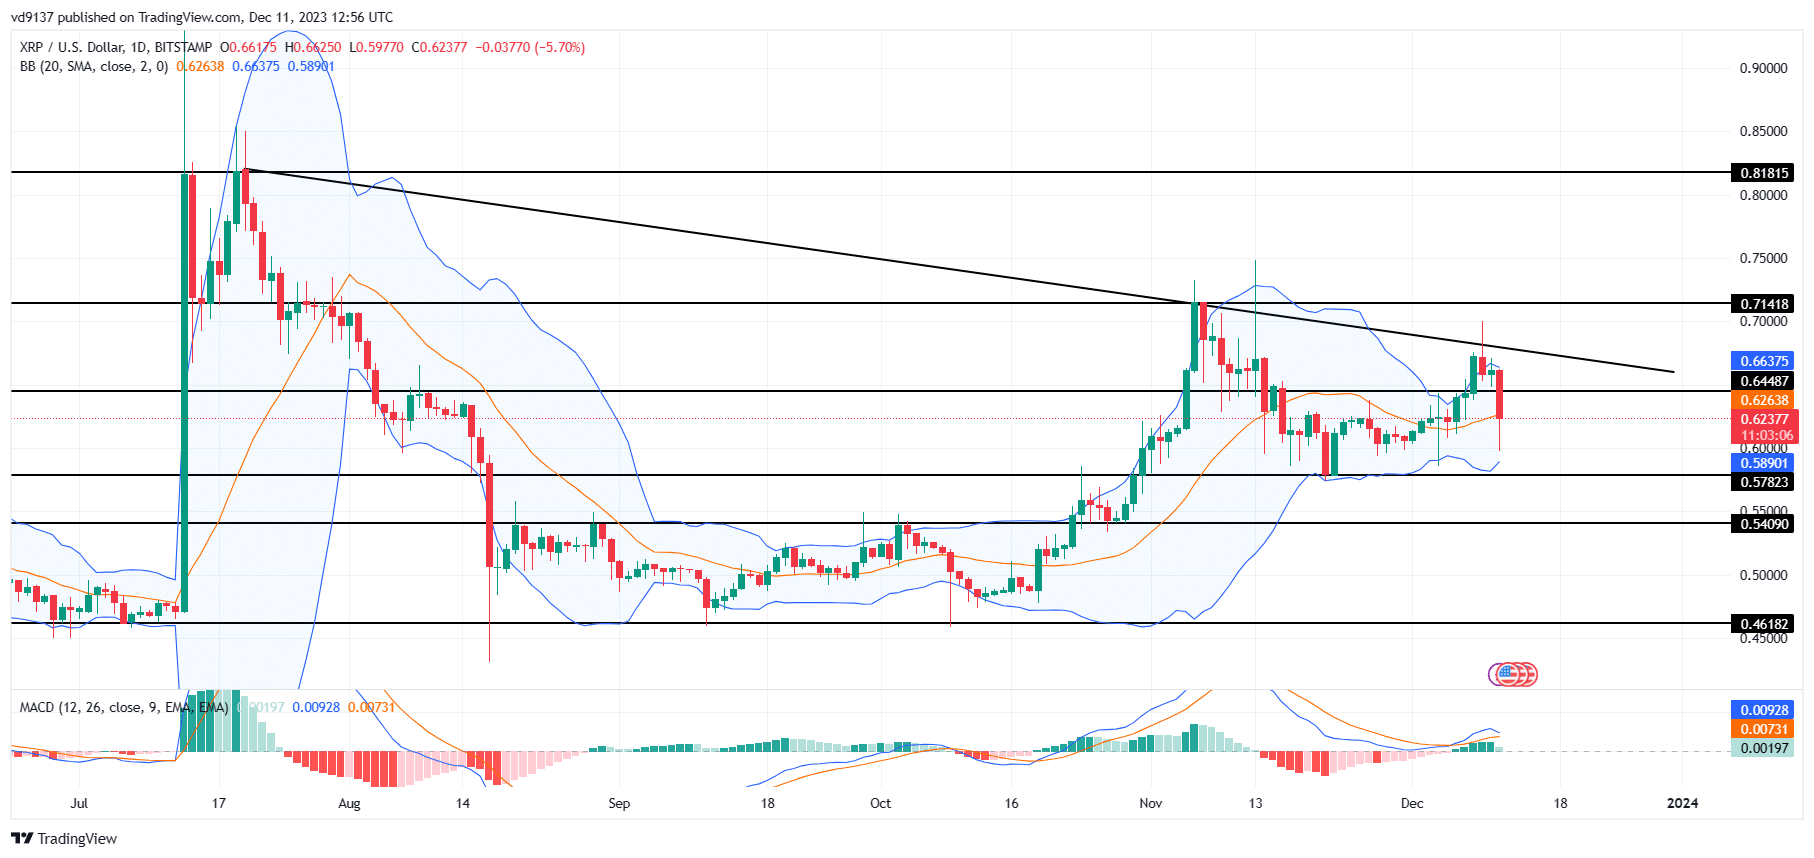
Hyping up the bullish hope for a breakout, the XRP price shoots from $0.57 and tests the overhead trendline. However, the hot bullish momentum chills down as the overhead supply leads a long wick candle, igniting a pullback phase.
Failing to unleash the uptrend with a slanted cup and handle pattern, the coin price reverts under $0.65 and approaches the bottom support of $0.60. Further, testing the patience of XRP holders, the ongoing correction may leave a big dent if it falls below the $0.57 mark.
Currently, the daily candle shows the XRP price trading at $0.62 and results in a bearish engulfing candle. However, the long wick keeps the bullish hope of reversal alive and may lead to a bounce back in the coming days or even hours.
Can XRP Sustain The Bullish Breakout Confidence?
The XRP price recovery fails to rechallenge the $0.70 mark and takes an early reversal, forming a lower high formation. Generating a downtrend under the influence of an overhead trendline, the altcoin walks on thin ice.
Considering the recovering market conditions help the coin price bounce back to give a break, the uptrend can reclaim $1 in 2023 with the Santa rally. However, a fall under $0.57 will make this even more difficult and might result in Ripple(XRP) ending the year at $0.50.
- Bollinger band: A reversal from the upper boundary of the Bollinger band indicator reflects the sellers are currently having an upper hand.
- MACD indicator. A bullish crossover between MACD and signal lines fails to sustain and teases a negative crossover.

Why Trust CoinGape
CoinGape has covered the cryptocurrency industry since 2017, aiming to provide informative insights Read more…to our readers. Our journal analysts bring years of experience in market analysis and blockchain technology to ensure factual accuracy and balanced reporting. By following our Editorial Policy, our writers verify every source, fact-check each story, rely on reputable sources, and attribute quotes and media correctly. We also follow a rigorous Review Methodology when evaluating exchanges and tools. From emerging blockchain projects and coin launches to industry events and technical developments, we cover all facets of the digital asset space with unwavering commitment to timely, relevant information.
24 Hours volume
$1.65B
Market Cap
$81.11B
Max Supply
100B


