XRP Price Prediction: Will $0.48 Support Hold or Break?
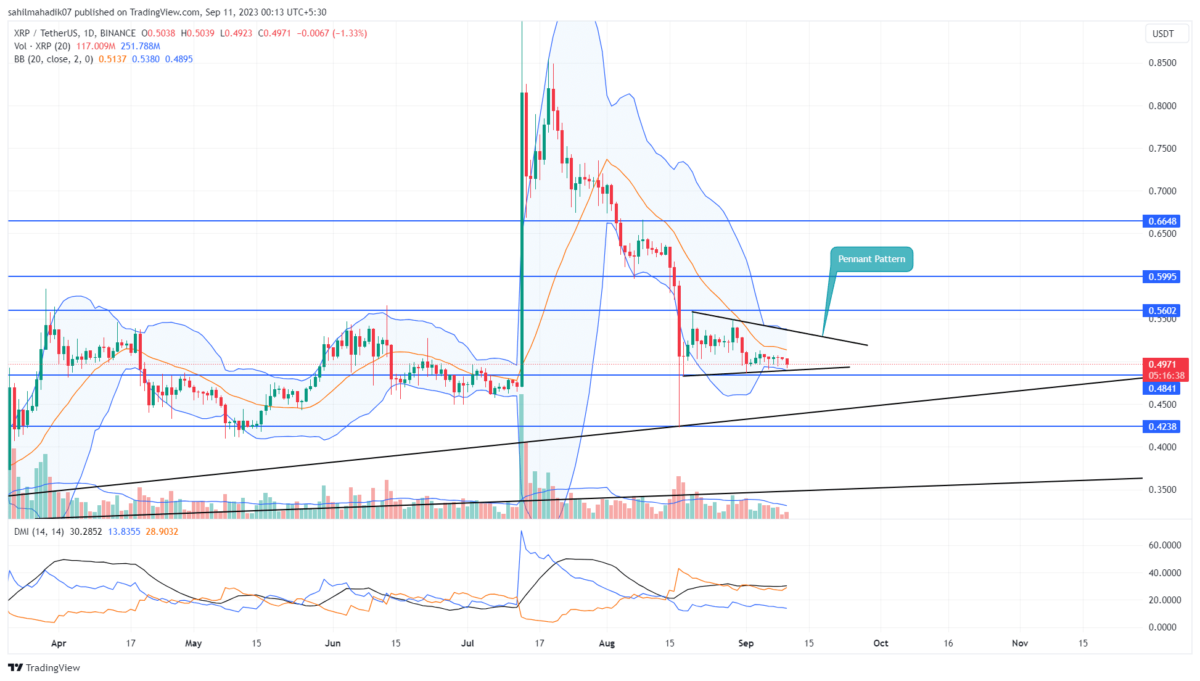
In the midst of prevailing crypto market uncertainty, the XRP price seems to have anchored itself near the $0.48 region. For the past three weeks, the coin price trajectory has been more horizontal than vertical, oscillating within a confined range dictated by two intersecting trend lines. This pattern, known by the trading analysis as a ‘ bearish pennant’, typically leans bearish in nature.
Also Read: XRP Holder’s Lawyer Reveals Regional Composition of Those He’s Representing
Bullish Reversal from Key Support Set a Quick 6% Jump
- The daily candle with lower price rejection indicates at the support trendline the demand pressure near $0.5 is intact
- A bearish breakdown from the triangle pattern will set the XRP price at 8.5%
- The intraday trading volume in the XRP is $454 Million, indicating a 9.6% gain
Over the past seven days, XRP price activity has been rather turbulent, constantly wavering above the triangle pattern’s support trendline. The daily chart reveals multiple short-bodied candles with minor price rejections, indicating the indecisive nature of market participants.
Nevertheless, patterns like these often see the price bounce off the support trendline, making its way upward to test the triangle’s upper boundary. With this behavior in mind, there’s potential for XRP to witness a 6% surge, possibly challenging the pennant’s resistance.
Yet, if we’re playing by the book, this pattern often concludes with a break below the lower trendline, potentially ushering XRP price towards the $0.45 mark, a possible decrease of 8.5%.
Will Buyers Rise Back to $0.6?
While bearish undertones color the current XRP narrative, it’s crucial to remember that as long as the pennant holds, the horizontal trend remains dominant. On a brighter note, should the price ascend beyond the triangle’s upper boundary, it could catalyze an influx of buyers, and surge a recovery to $0.6
- Bollinger Band: The narrow range of Bollinger Band indicators reflects the uncertain market trend.
- Directional Movement Index: A negative alignment between the DI+(blue) and DI-(orange) indicates the overall trend remains bearish.
Recent Posts
- Price Analysis
Pi Coin Price Prediction as Expert Warns Bitcoin May Hit $70k After BoJ Rate Hike
Pi Coin price rose by 1.05% today, Dec. 18, mirroring the performance of Bitcoin and…
- Price Analysis
Cardano Price Outlook: Will the NIGHT Token Demand Surge Trigger a Rebound?
Cardano price has entered a decisive phase as NIGHT token liquidity rotation intersects with structural…
- Price Analysis
Will Bitcoin Price Crash to $74K as Japan Eyes Rate Hike on December 19?
Bitcoin price continues to weaken after breaking below its recent consolidation range, now trading within…
- Price Analysis
Bitwise Predicts Solana Price Will Hit New All-Time Highs in 2026
Solana price declined by 4% over the past 24 hours, breaking below the key $130…
- Price Analysis
Bitcoin Price Outlook: Capriole Founder Warns of a Drop Below $50K by 2028
Bitcoin price narratives continue to evolve as long-term downside risks regain attention. Bitcoin price discussions…
- Price Analysis
XRP Price Rare Pattern Points to a Surge to $3 as ETFs Cross $1B Milestone
XRP price dropped by 1.2% today, Dec. 17, continuing a downward trend that started in…