XRP Price Prediction: Will the Ongoing Correction Hit $0.4?
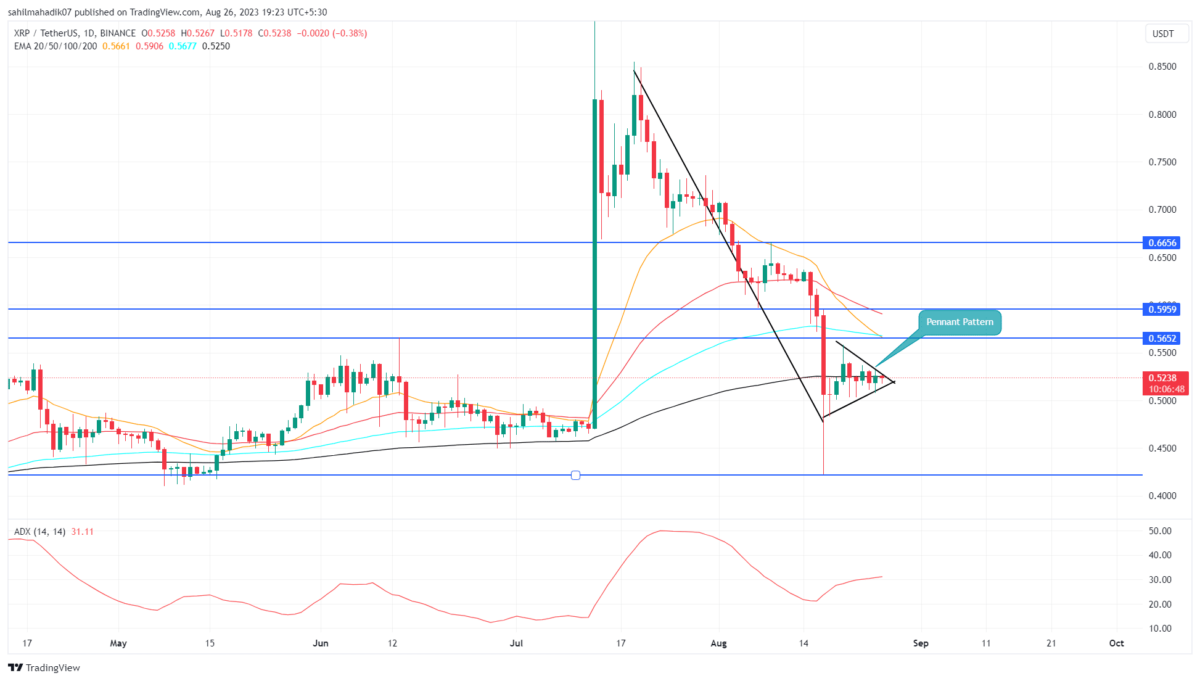
On August 17th, the XRP price printed a massive red candle on the daily time frame chart, recording a high and low of $0.5948 and $0.4226 respectively. Though this downfall triggered a notable negative sentiment among traders, the price action went sideways immediately. Thus, uncertainty could be associated with the choppy price behavior of the largest cryptocurrency, the XRP price has shaped into a bearish pennant pattern.
Also Read: Ripple Vs US SEC Trial No Earlier Than This Date, XRP Price Rebounds
XRP Daily Chart: Key Points
- The range between the triangle structure can be marked as a no-trading zone.
- A bearish crossover between the 20-and-100-day EMA may accelerate the supply pressure among market participants.
- The intraday trading volume in the XRP is 823.5 Million, indicating a 12.75% loss.
In response to the indecisive market sentiment, the XRP price has been wavering sideways for over a week. A keen look at the 4-hour time frame chart shows the price action is confined in a narrow range within the two converging trendlines, forming a triangular shape.
After a massive downfall, this triangle setup indicates the formation of a bearish pennant pattern. By the press time, the XRP coin traded at $0.523 with an intraday loss of 0.51%.
Considering a higher possibility, the crypto sellers are likely to break the pattern’s lower support and accelerate the bearish momentum in price. The post-breakdown fall could plunge the altcoin’s market value by 18.8% revisiting the $0.422 low.
[converter id=”xrp-xrp” url=”https://coingape.com/price/converter/xrp-to-usd/?amount=1″]
Can XRP Buyer Make a Comeback?
While the overall market sentiment and price behavior support sellers, buyers may get an opportunity to counterattack if they break the upper trendline of the pattern. A bullish breakout from the overhead trendline will intensify bullish momentum and prepare a significant upswing in XRP price. However, the anticipated recovery must close above the August 17th high of $0.5948 for better confirmation.
- Exponential Moving Average: The 20-day EMA slope may offer dynamic resistance against the bullish bounce
- Average Directional Index: An uptick in the daily ADX slope at 31% indicates sellers can carry further downfall.
Recent Posts
- Price Analysis
Cardano Price Outlook: Will the NIGHT Token Demand Surge Trigger a Rebound?
Cardano price has entered a decisive phase as NIGHT token liquidity rotation intersects with structural…
- Price Analysis
Will Bitcoin Crash to $74K as Japan Eyes Rate Hike on December 19?
Bitcoin price continues to weaken after breaking below its recent consolidation range, now trading within…
- Price Analysis
Bitwise Predicts Solana Price Will Hit New All-Time Highs in 2026
Solana price declined by 4% over the past 24 hours, breaking below the key $130…
- Price Analysis
Bitcoin Price Outlook: Capriole Founder Warns of a Drop Below $50K by 2028
Bitcoin price narratives continue to evolve as long-term downside risks regain attention. Bitcoin price discussions…
- Price Analysis
XRP Price Rare Pattern Points to a Surge to $3 as ETFs Cross $1B Milestone
XRP price dropped by 1.2% today, Dec. 17, continuing a downward trend that started in…
- Price Analysis
DOGE Whales Add 138M Coins in 24 Hours: Will Dogecoin Price Rebound Above $0.15?
Dogecoin price traded at $0.1304 on Tuesday, up 1.39% in the last 24 hours.…