XRP Price Prediction: Will Rising FUD Push Prices Below $0.5?


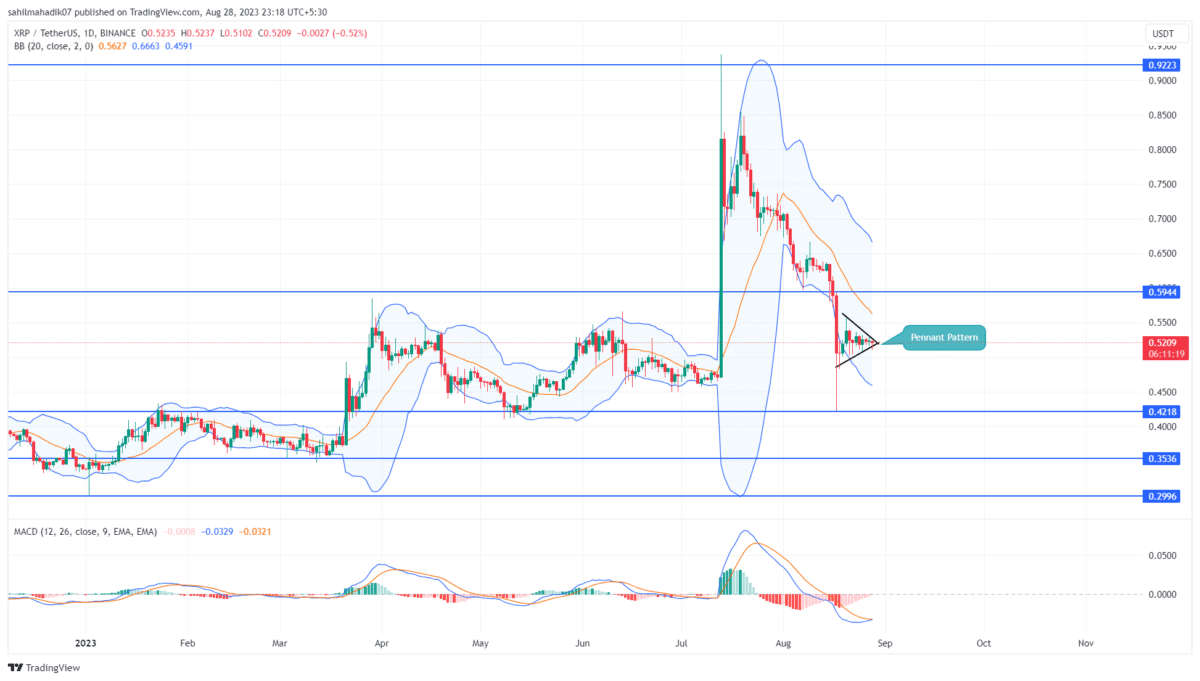
The volatile price action of the leading cryptocurrency Bitcoin has led to an atmosphere of uncertainty even in major altcoins. As a result, the XRP price has been a sideways trend for nearly two weeks, resonating between two converging trendlines. This consolidation resembled the formation of a bearish pennant pattern indicating the fifth largest cryptocurrency is poised for prolonged downfall.
Also Read: XRP Whale Makes Humongous Transfer To Unknown Wallet; What It Means?
XRP Daily Chart: Key Points
- A breakdown below from the pennant pattern may set the XRP price for an 18.5% drop
- The $0.6 barrier may stand as a high supply zone for crypto sellers.
- The intraday trading volume in the XRP is $853.5 Million, indicating a 53% gain.
 Source: Tradingview`
On the daily time frame chart, a series of short-bodied candles can be observed within the confines of a triangle formation. These neutral candles mirror the hesitancy among traders, showcasing their uncertain market sentiment. As the XRP price hovers around the $0.52 mark and approaches the triangle’s apex, it hints at an imminent breakout opportunity on the horizon.
Amid the increasing bearishness in the market, the XRP price is likely to break the bottom trendline. This breakdown could plunge the prices 18.5% down to hit a $0.422 low.
[converter id=”xrp-xrp” url=”https://coingape.com/price/converter/xrp-to-usd/?amount=1″]
Will XRP Price Extend Correction to $0.4?
Anyhow, the whole sideways trend is wavering within the range of the August 17th daily candle spread from $0.594 to $0.421. These levels may act as crucial resistance and support offerings to traders and could trigger a short-term sideways trend in XRP price. However, with the anticipated breakdown of the pennant pattern, the crypto sellers may give a breakdown attempt below $0.422 to lead the price to $0.4.
- Bollinger Band: The downsloping lower band of the Bollinger Band indicator reflects the selling momentum in active.
- Moving Average Convergence Divergence: A potential bullish crossover between the MACD(blue)and signal(orange) can bolster a minor pullback in a prevailing downtrend.

Why Trust CoinGape
CoinGape has covered the cryptocurrency industry since 2017, aiming to provide informative insights Read more…to our readers. Our journal analysts bring years of experience in market analysis and blockchain technology to ensure factual accuracy and balanced reporting. By following our Editorial Policy, our writers verify every source, fact-check each story, rely on reputable sources, and attribute quotes and media correctly. We also follow a rigorous Review Methodology when evaluating exchanges and tools. From emerging blockchain projects and coin launches to industry events and technical developments, we cover all facets of the digital asset space with unwavering commitment to timely, relevant information.

Related Articles


- Jane Street and Abu Dhabi Wealth Fund Mubadala Increase Holdings In BlackRock’s Bitcoin ETF
- FOMC Minutes Drop Tomorrow: Will Crypto Market Rally or Face Fed Shock?
- BlackRock Amends Filing For Staked Ethereum ETF, Eyes 18% of Staking Rewards From ETH Fund
- Arizona Advances Bitcoin, XRP Reserve Bill Using Seized Crypto Assets
- Bitcoin ETF Update: BlackRock Signals BTC Sell-Off as Kevin O’Leary Warns of Decline In Institutional Demand
- Pi Network Price Beats Bitcoin, Ethereum, XRP as Upgrades and Potential CEX Listing Fuels Demand
- 5 Things Dogecoin Price Needs to Hit $0.20 in Feb 2026
- Bitcoin Price Prediction as Experts Warns of Quantum Risks
- Dogecoin, Shiba Inu, Pepe Coin Price Predictions As BTC Crashes Below $68k
- Ethereum Price Outlook as Harvard Shifts Focus from Bitcoin to ETH ETF
- HOOD and COIN Stock Price Forecast as Expert Predicts Bitcoin Price Crash to $10k


