XRP Price Prediction: Will Rising FUD Push Prices Below $0.5?
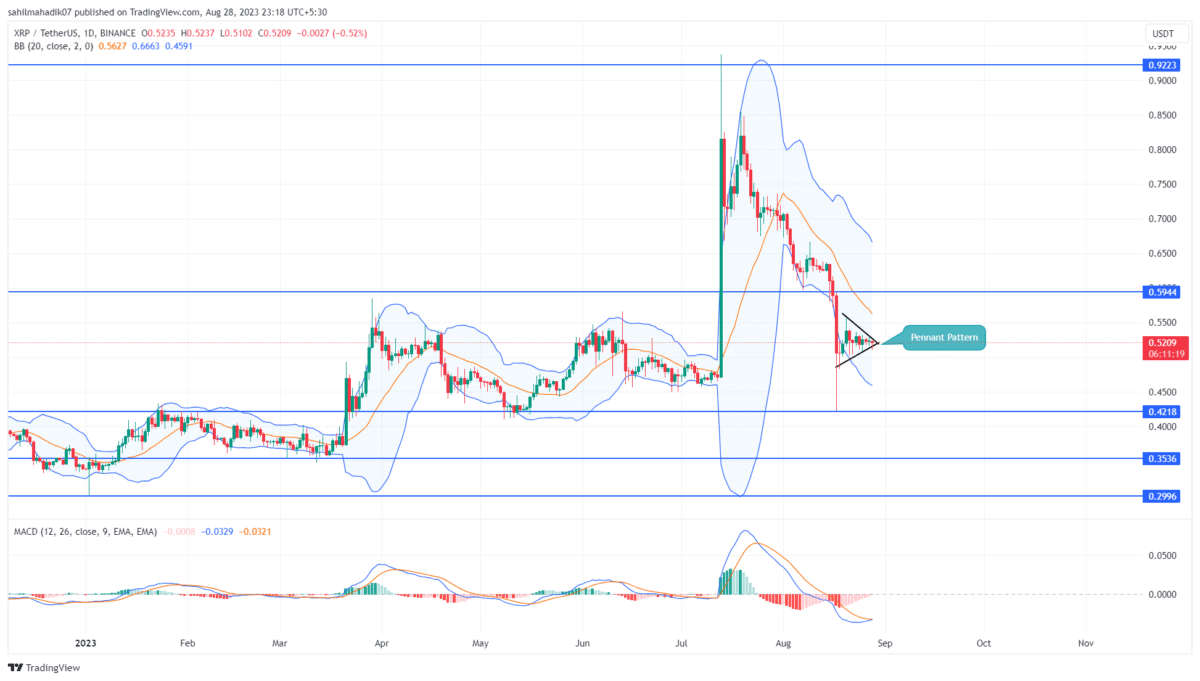
The volatile price action of the leading cryptocurrency Bitcoin has led to an atmosphere of uncertainty even in major altcoins. As a result, the XRP price has been a sideways trend for nearly two weeks, resonating between two converging trendlines. This consolidation resembled the formation of a bearish pennant pattern indicating the fifth largest cryptocurrency is poised for prolonged downfall.
Also Read: XRP Whale Makes Humongous Transfer To Unknown Wallet; What It Means?
XRP Daily Chart: Key Points
- A breakdown below from the pennant pattern may set the XRP price for an 18.5% drop
- The $0.6 barrier may stand as a high supply zone for crypto sellers.
- The intraday trading volume in the XRP is $853.5 Million, indicating a 53% gain.
On the daily time frame chart, a series of short-bodied candles can be observed within the confines of a triangle formation. These neutral candles mirror the hesitancy among traders, showcasing their uncertain market sentiment. As the XRP price hovers around the $0.52 mark and approaches the triangle’s apex, it hints at an imminent breakout opportunity on the horizon.
Amid the increasing bearishness in the market, the XRP price is likely to break the bottom trendline. This breakdown could plunge the prices 18.5% down to hit a $0.422 low.
[converter id=”xrp-xrp” url=”https://coingape.com/price/converter/xrp-to-usd/?amount=1″]
Will XRP Price Extend Correction to $0.4?
Anyhow, the whole sideways trend is wavering within the range of the August 17th daily candle spread from $0.594 to $0.421. These levels may act as crucial resistance and support offerings to traders and could trigger a short-term sideways trend in XRP price. However, with the anticipated breakdown of the pennant pattern, the crypto sellers may give a breakdown attempt below $0.422 to lead the price to $0.4.
- Bollinger Band: The downsloping lower band of the Bollinger Band indicator reflects the selling momentum in active.
- Moving Average Convergence Divergence: A potential bullish crossover between the MACD(blue)and signal(orange) can bolster a minor pullback in a prevailing downtrend.
Recent Posts
- Price Analysis
XRP Price Outlook Ahead of US Strategic Crypto Reserve
XRP price hovered near the $1.80 support level on December 27 ahead of the anticipated…
- Price Analysis
Ethereum Price Prediction Ahead of the 2026 Glamsterdam Scaling Upgrade – Is $5,000 Back in Play?
Ethereum price is in a critical stage as ETH price is in line with the…
- Price Analysis
Cardano Price Eyes a 40% Surge as Key DeFi Metrics Soar After Midnight Token Launch
Cardano price remains in a deep bear market, continuing a sell-off that started in December…
- Price Analysis
FUNToken Price Surges After MEXC Lists $FUN/USDC Pair
FUNToken, one of the most talked-about low-cap cryptos on the market with P2E undertones, has…
- Price Analysis
Bitcoin Price on Edge as $24B Options Expire on Boxing Day — Is $80K About to Crack?
Bitcoin enters the final stretch of the year with the price behavior signaling a decisive…
- Price Analysis
Crypto Market Rebounds: Are Bulls Positioning for a Santa Rally?
Crypto markets saw a 0.94% rise in the last 24 hours, contributing to a…