XRP Price Wavers in Make-or-Break Situation; What’s Next $0.55 or $0.4?
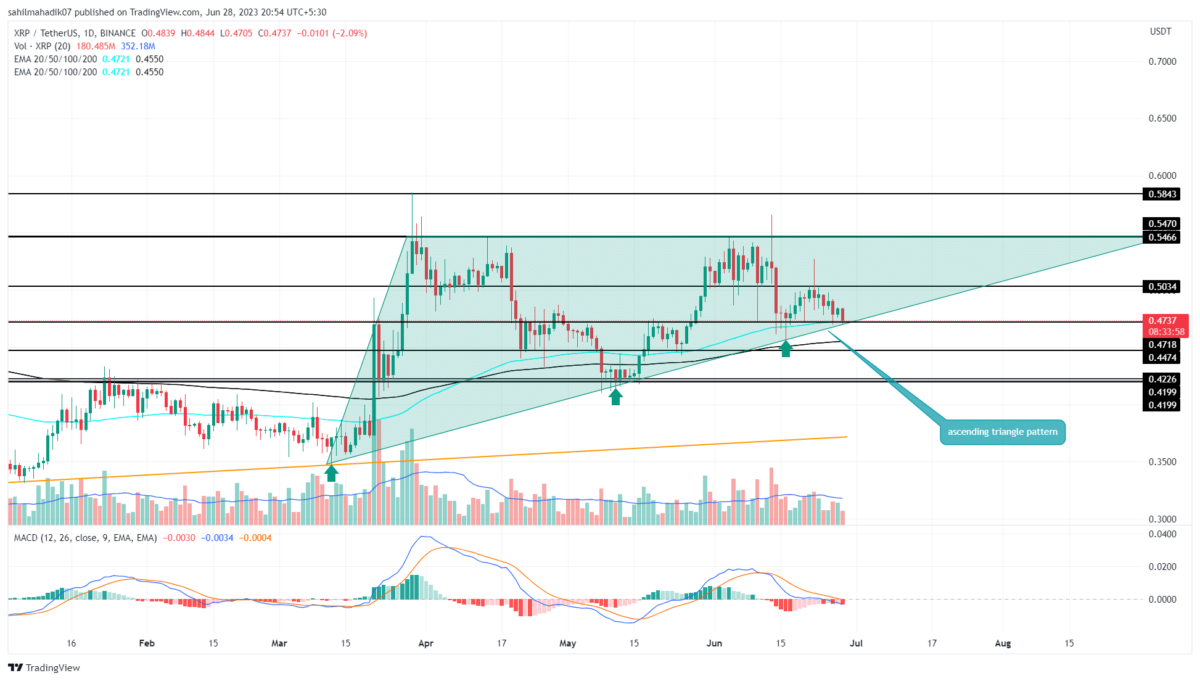
The XRP coin has remained an underperforming crypto asset throughout June. Even the minor recovery witnessed during this month’s third week has evaporated and the coin’s market value plunged back to the $0.474 mark. However, a look at the longer time frame chart reflects that buyers are respecting an ascending support trendline of a bullish continuation pattern called ascending triangle.
Also Read: Why July Is Crucial For Ripple Vs SEC Lawsuit, XRP Price & Overall Crypto Market?
XRP Price Daily Chart:
- A retest to the ascending support could replenish the bullish momentum.
- The 100-day EMA slope offers dynamic support to the XRP price
- The intraday trading volume in the XRP is $818.3 Million, indicating a 10.8% loss.
With an intraday loss of 2.36%, the XRP price plunged back to the long-coming support trendline. The coin price has already bounced from this support thrice indicating buyers are accumulating this coin at dips.
If the coin price manages to sustain this support, the market participants can expect another reversal. Each reversal creates a new higher low, where the buyers get closer to the overhead resistance of $0.55 and increased the potential of a bullish breakout.
This anticipated reversal could drive the XRP price to the $0.5 mark, followed by $0.55.
What If XRP Price Breaks Support Trendline?
The rising trendline within the triangle pattern has played a crucial role in sustaining the upward momentum of XRP’s price over the last 100 days. However, the growing supply pressure in the market raises concerns. Should the price break below the ascending trendline, it would undermine the bullish outlook. Consequently, this could trigger a significant sell-off, leading to a potential 10% decline in XRP, with a target price of $0.4.
- Exponential Moving Average: The XRP price above the 100-and-200-day EMA slope reflects the overall trend remains bullish.
- Moving Average Convergence Divergence: A possible breakdown of MACD(Blue) and signal(orange) below the neutral line could increase the selling momentum in XRP Price.
Recent Posts
- Price Analysis
Pi Coin Price Prediction as Expert Warns Bitcoin May Hit $70k After BoJ Rate Hike
Pi Coin price rose by 1.05% today, Dec. 18, mirroring the performance of Bitcoin and…
- Price Analysis
Cardano Price Outlook: Will the NIGHT Token Demand Surge Trigger a Rebound?
Cardano price has entered a decisive phase as NIGHT token liquidity rotation intersects with structural…
- Price Analysis
Will Bitcoin Price Crash to $74K as Japan Eyes Rate Hike on December 19?
Bitcoin price continues to weaken after breaking below its recent consolidation range, now trading within…
- Price Analysis
Bitwise Predicts Solana Price Will Hit New All-Time Highs in 2026
Solana price declined by 4% over the past 24 hours, breaking below the key $130…
- Price Analysis
Bitcoin Price Outlook: Capriole Founder Warns of a Drop Below $50K by 2028
Bitcoin price narratives continue to evolve as long-term downside risks regain attention. Bitcoin price discussions…
- Price Analysis
XRP Price Rare Pattern Points to a Surge to $3 as ETFs Cross $1B Milestone
XRP price dropped by 1.2% today, Dec. 17, continuing a downward trend that started in…