MATIC, Polkadot Price Analysis: June 15, 2021

Bitcoin accomplished the bid for $40,000 as bulls closed the day above this crucial level for the first time in June. Fears of Bitcoin price dropping to close the CME BTC futures gap to $37,325 seem to have been curtailed. At the time of writing, the bellwether cryptocurrency trades at $40,517 following a 3.8% gain in 24 hours.
The rest of the crypto market is in the green following Bitcoin’s price upswing. Polkadot (DOT) and Polygon (MATIC) seem to be leading altcoins in recovery, posting gains of 16% and 11%, respectively.
MATIC nurtures a V-shaped rally
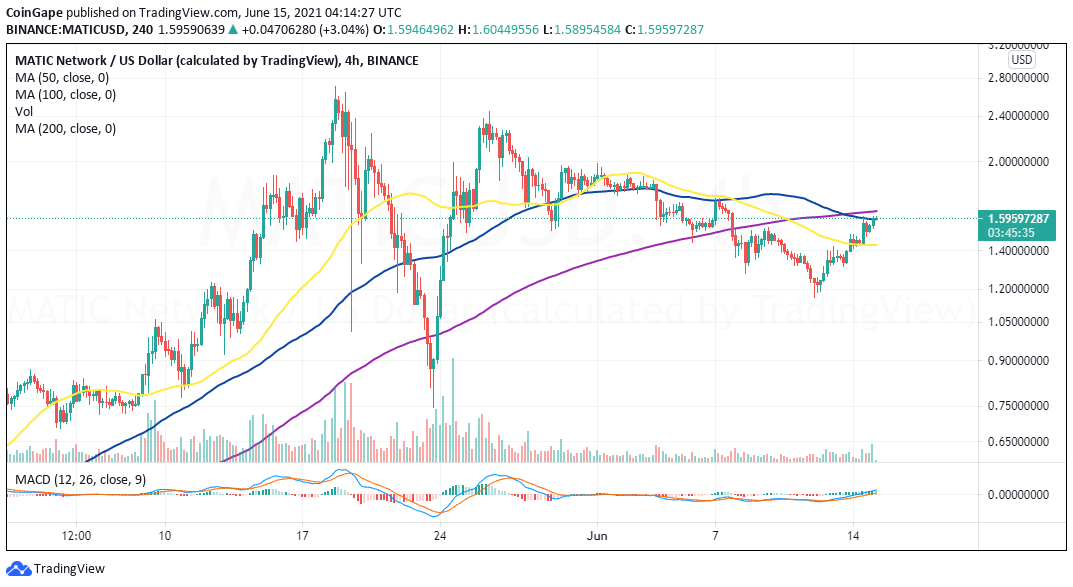
Polygon has been building on the support at $1.2 since late last week. Although the weekend session was relatively mundane, MATIC managed to avoid further breakdown. The trading on Monday set the precedence for the ongoing upswing, with Polygon dancing at $1.59.
The token’s immediate upside is limited by the 100 Simple Moving Average (SMA) resistance on the four-hour chart. Marginally above zone, the 200 SMA is in line to burden the bulls.
It is worth noting that the Moving Average Convergence Divergence (MACD) indicator has a vivid bullish outlook. The trend momentum indicator had crossed above the zero line in addition to the MACD line (blue), expanding the divergence above the signal line. If this technical outlook remains intact, we can expect Polygon to stretch the bullish leg to $2.
MATIC/USD four-hour chart
Polkadot flashes buy signal
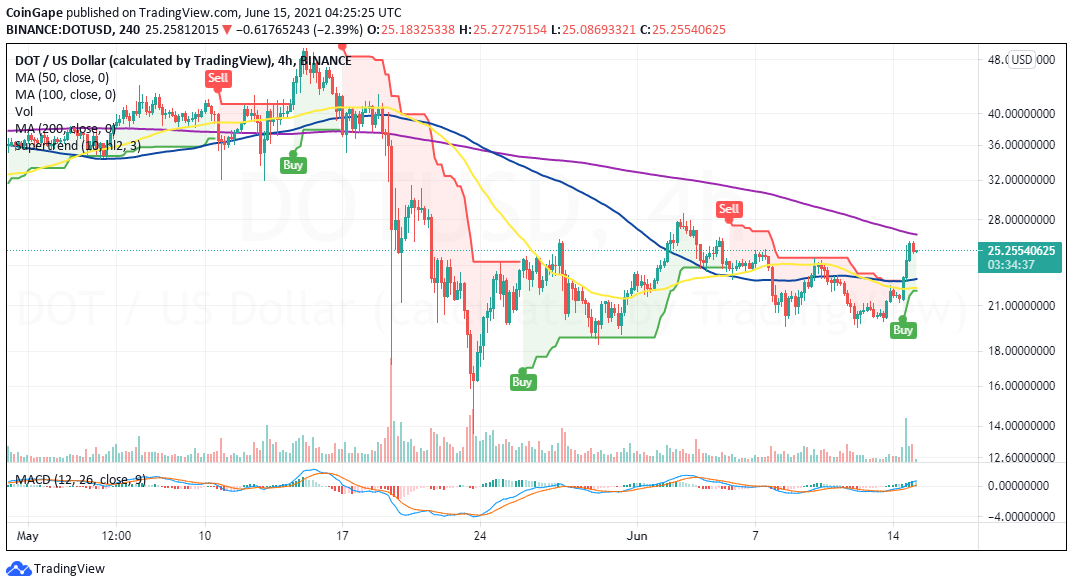
Polkadot recoiled from support at $20 last week. The uptrend slowed down during the weekend session but resumed on Monday, whereby gains extended to $26. According to the four-hour chart, bulls are currently the favored lot, with the MACD settling above zero.
Similarly, the MACD line expands the gap above the signal line, adding credence to the bullish outlook. In the meantime, the SuperTrend indicator has presented a buy signal, implying that the slightest resistance path is upward. Thus, if buyers heed the call and increase their entries, it will be a matter of time before DOT hits $28 and close the gap to $30.
DOT/USD four-hour chart
The resistance at the 200 SMA must not be ignored because it could invalidate the upswing, perhaps lead to a correction back to $21 and $20, respectively.
Recent Posts
- Crypto News
Fed’s Williams Says No Urgency to Cut Rates Further as Crypto Traders Bet Against January Cut
New York Federal Reserve President John Williams has signaled his support for holding rates steady…
- Crypto News
Trump to Interview BlackRock’s Rick Rieder as Fed Chair Shortlist Narrows to Four
The Fed chair race is heating up with U.S. President Donald Trump set to interview…
- Crypto News
Breaking: VanEck Discloses Fees and Staking Details for its Avalanche ETF
The leading crypto asset manager VanEck amends its Avalanche ETF with the U.S. Securities and…
- Crypto News
Crypto Market Braces for Volatility as BTC, ETH Options Expiry Collides $7.1 Trillion ‘Triple Witching’
Crypto market traders are bracing for heightened volatility and a potential crash as Bitcoin and…
- Crypto News
Terraform Labs Lawsuit: Jump Trading Faces $4B Case over Market Manipulation
While the crypto market has yet to fully recover from the $40 billion collapse of…
- Crypto News
Coinbase Challenges US States Over Regulatory Restrictions on Prediction Markets
Coinbase Global, the largest cryptocurrency exchange in the United States, has filed lawsuits against three…