Polkadot Price Analysis: DOT is drawing closer to a 31% upswing, eying $50

- Polkadot is trading at the apex of a symmetrical triangle pattern ahead of the anticipated liftoff to 50.
- The resistance at $40 remains the biggest hindrance to the bullish outlook.
Polkadot is among the few cryptoassets set to begin the week in the green. Bitcoin surprised many by making a real break above $60,000 over the weekend. DOT is most likely following in its footsteps to achieve another record high.
Meanwhile, DOT is trading at the apex of a symmetrical triangle. This pattern highlights a period of consolidation in addition to a potential breakout or breakdown.
The symmetrical triangle is formed by two trendlines whereby one connects a series of higher lows and a series of higher lows. A breakout will occur as soon as the price slices through the upper trendline. The move to the north is usually drastic and confirmed by a sudden increase in trading volume. Triangle breakouts have exact targets measure from the pattern’s highest to lowest points.
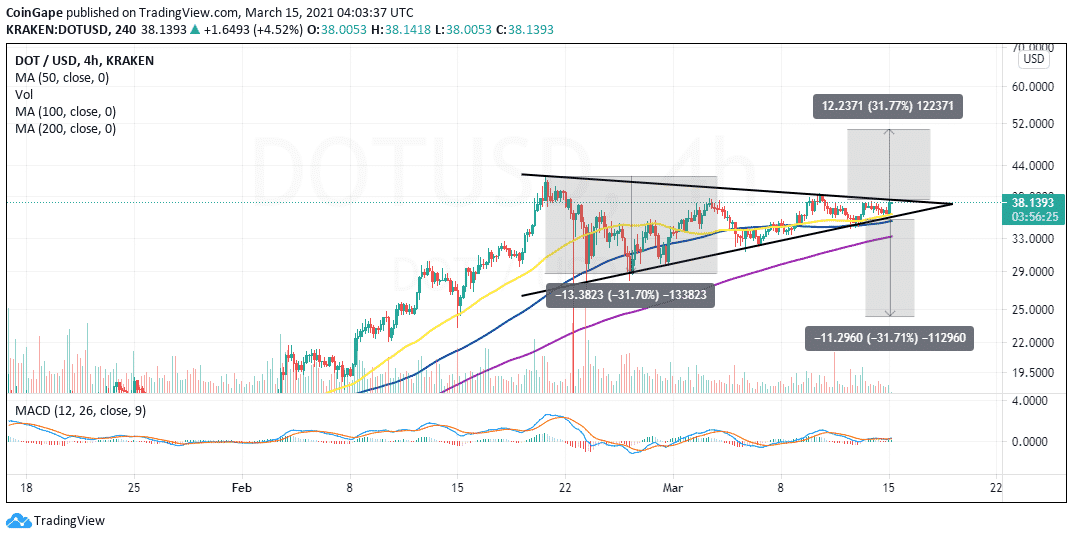
Polkadot is very close to breaking above the upper trendline, where it will launch 31% higher to a new all-time high. The anticipated upswing will be reinforced if the MACD sustains the cross above the signal line. Moreover, the indicator should stay within the positive region to secure the bullish impulse.
DOT/USD 4-hour chart
Note that the bullish outlook will fail to hold if Polkadot upside is continually limited under the upper trendline, and by association, the seller congestion at $40. On the downside, the 50 Simple Moving Average is in line to offer support. Massive losses eyeing levels under $25 will come into the picture in the symmetrical triangle breakdown.
Recent Posts
- Uncategorized
Pi Network News: Pi Team Freezes All Payments Following Multi-Million Token Theft
The Pi community has pointed out an operation of scamming that has caused innocent users…
- Crypto News
Trump Tariffs 2026: How Bitcoin, Ethereum, and Altcoins Could Be Affected
The crypto market’s fate in 2026 hangs in the balance as US President Donald Trump’s…
- Crypto News
US Risks Losing Digital Finance Edge: Coinbase Warns of China CBDC Advantage
Amid the rising competition in the global digital finance space, the United States is facing…
- Crypto News
Is TRUMP Coin Officially Dead? Team Allegedly Cashes Out $94M USDC in Massive Sell-Off
Fresh on-chain evidence has reignited rumors that the TRUMP Coin project is dead. This came…
- Altcoin News
Arthur Hayes Snaps Up $4M in DeFi Tokens via Ethereum Sell-Off
Arthur Hayes, the co-founder of BitMEX, has once again made headlines in the crypto industry…
- Crypto ETF News Today
Crypto ETF News: Bitwise Moves to Launch ETFs Linked to ZEC, HYPE, and SUI
Crypto ETF issuer Bitwise has filed a series of documents with the U.S. SEC to…