Polkadot Price Forecast: DOT flashing Buy Signals but Is It the Right Time to Buy?


- Polkadot bulls are nurturing a potential breakout after spiking above a short term triangle pattern.
- DOT/USD drastic price action is delayed by the resistance at the 50 SMA.
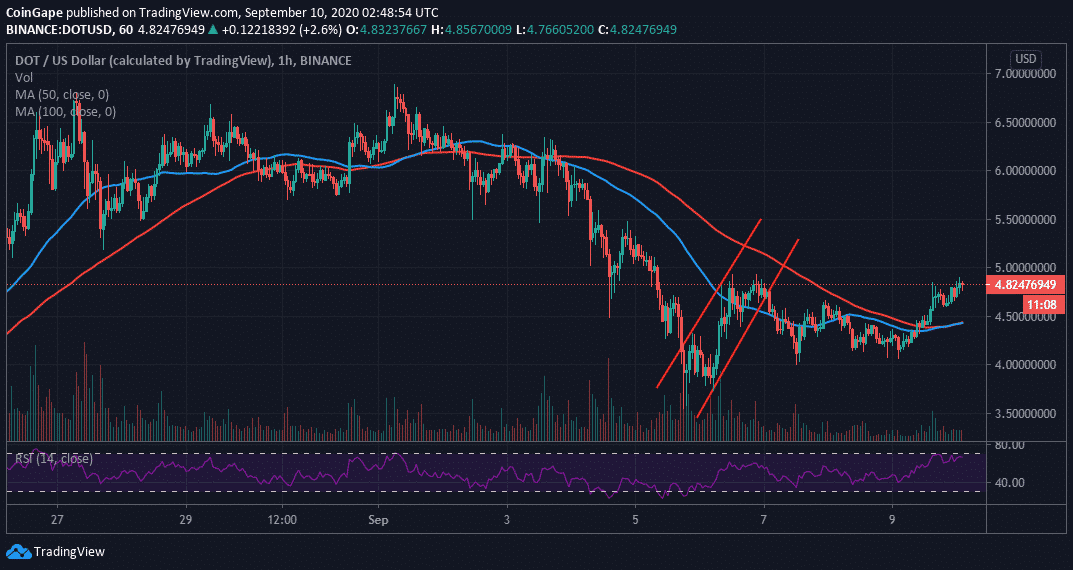
Polkadot broke down from the ascending channel, discussed last week. Luckily, support at $4.00 came in handy, preventing acute declines from taking over. A reversal, therefore, ensued with buyers increasing their entries. A break above both the 50 Simple Moving Average (SMA) and the 100 SMA in the 1-hour chart encouraged the bulls to increase their entries in anticipation of a rally towards $5.00. At the time of writing, DOT/USD is dancing at $4.80 amid a struggle to overcome the short term resistance at $5.00.
DOT/USD 1-hour chart
The 4-hour chart, prints a bullish picture for DOT/USD, especially after a breakout above a falling triangle pattern. Triangle patterns are some of the most common technical analysis tools. They help the traders predict a change from the prevailing trend and the extent to which the new trend can reach. In this case, the triangle breakout is likely to catapult DOT above $5.00.
DOT/USD 4-hour chart
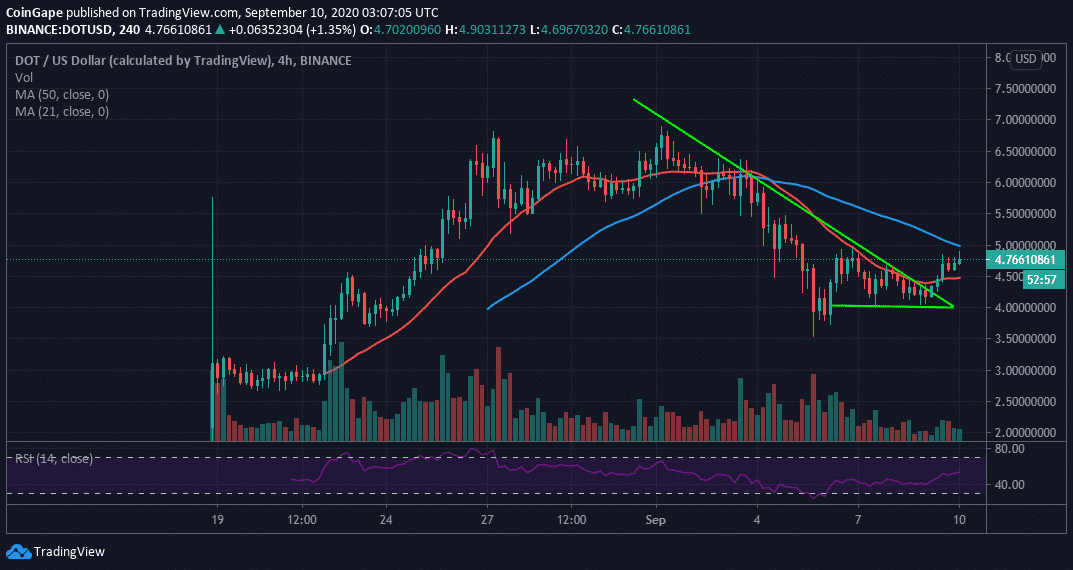
Subsequently, a break above the resistance at the 50 SMA would boost the price farther north. According to the Relative Strength Index (RSI), the uptrend is strong enough for a break above $5.00 in the near term. It t seems lack of enough volume is holding Dot from making a drastic spike. In other words, many are not believing that Polkadot is set for that significant move. This is most likely to invalidate the buy signal. Therefore, is it essential to hold on for a confirmed breakout, especially past the 50 SMA, before going all-in on DOT.
Polkadot Intraday Levels
Spot rate: $4.77
Relative change: 0.0682
Percentage change: 1.50
Trend: Short tern bullish bias
Volatility: Expanding

Why Trust CoinGape
CoinGape has covered the cryptocurrency industry since 2017, aiming to provide informative insights Read more… to our readers. Our journal analysts bring years of experience in market analysis and blockchain technology to ensure factual accuracy and balanced reporting. By following our Editorial Policy, our writers verify every source, fact-check each story, rely on reputable sources, and attribute quotes and media correctly. We also follow a rigorous Review Methodology when evaluating exchanges and tools. From emerging blockchain projects and coin launches to industry events and technical developments, we cover all facets of the digital asset space with unwavering commitment to timely, relevant information.
Delivered every day.
- Insights that move markets
- 100,000 active subscribers
Related Articles


- Will Bitcoin Crash Again as ‘Trump Insider’ Whale Dumps 6,599 BTC
- XRP News: Ripple’s RLUSD Gets Boost as CFTC Expands Approved Tokenized Collateral
- Crypto Markets Brace as Another Partial U.S. Government Shutdown Looms Next Week
- $40B Bitcoin Airdrop Error: Bithumb to Reimburse Customer Losses After BTC Crash To $55k
- ETH Price Fears Major Crash As Trend Research Deposits $1.8B Ethereum to Binance
- Cardano Price Prediction as Midnight Token Soars 15%
- Bitcoin and XRP Price Outlook Ahead of Crypto Market Bill Nearing Key Phase on Feb 10th
- Bitcoin Price Prediction as Funding Rate Tumbles Ahead of $2.1B Options Expiry
- Ethereum Price Outlook as Vitalik Buterin Sells $14 Million Worth of ETH: What’s Next for Ether?
- Solana Price at Risk of Crashing Below $50 as Crypto Fear and Greed Index Plunges to 5
- Pi Network Price Prediction Ahead of PI KYC Validator Reward System Launch


