Price Analysis: Uniswap, Chainlink And Pancakeswap Display Bullish Sentiments


No sooner had Bitcoin jumped up on its charts than the industry’s major coins appreciated. Uniswap registered a massive hike of 8.4% over the last 24 hours and was priced at $15.34 at the time of writing. For most of the month, the coin’s bearish price action was scattered between bullish price movements.
Uniswap/USD Four-Hour Chart

After noting a sharp pullback from the 50% Fibonacci level, Uniswap encountered resistance at the 38.2% level too. Uniswap has now attempted to make a bullish move, and the immediate price level stood at $16.30. After toppling the level mentioned above, the coin might stand to trade near the 38.2% Fibonacci level. This is the second time in the month that buyers dominated the market. If selling pressure takes over, the support mark stands at $13.86.
As mentioned above, the relative strength index was on an uptrend, and the indicator swayed towards a bullish force in the market. However, the Average Directional Index differed in its stance as the indicator pointed towards a weak market trend, which also suggests a possible price reversal in the upcoming trading sessions.
LINK/USD Four-Hour Chart
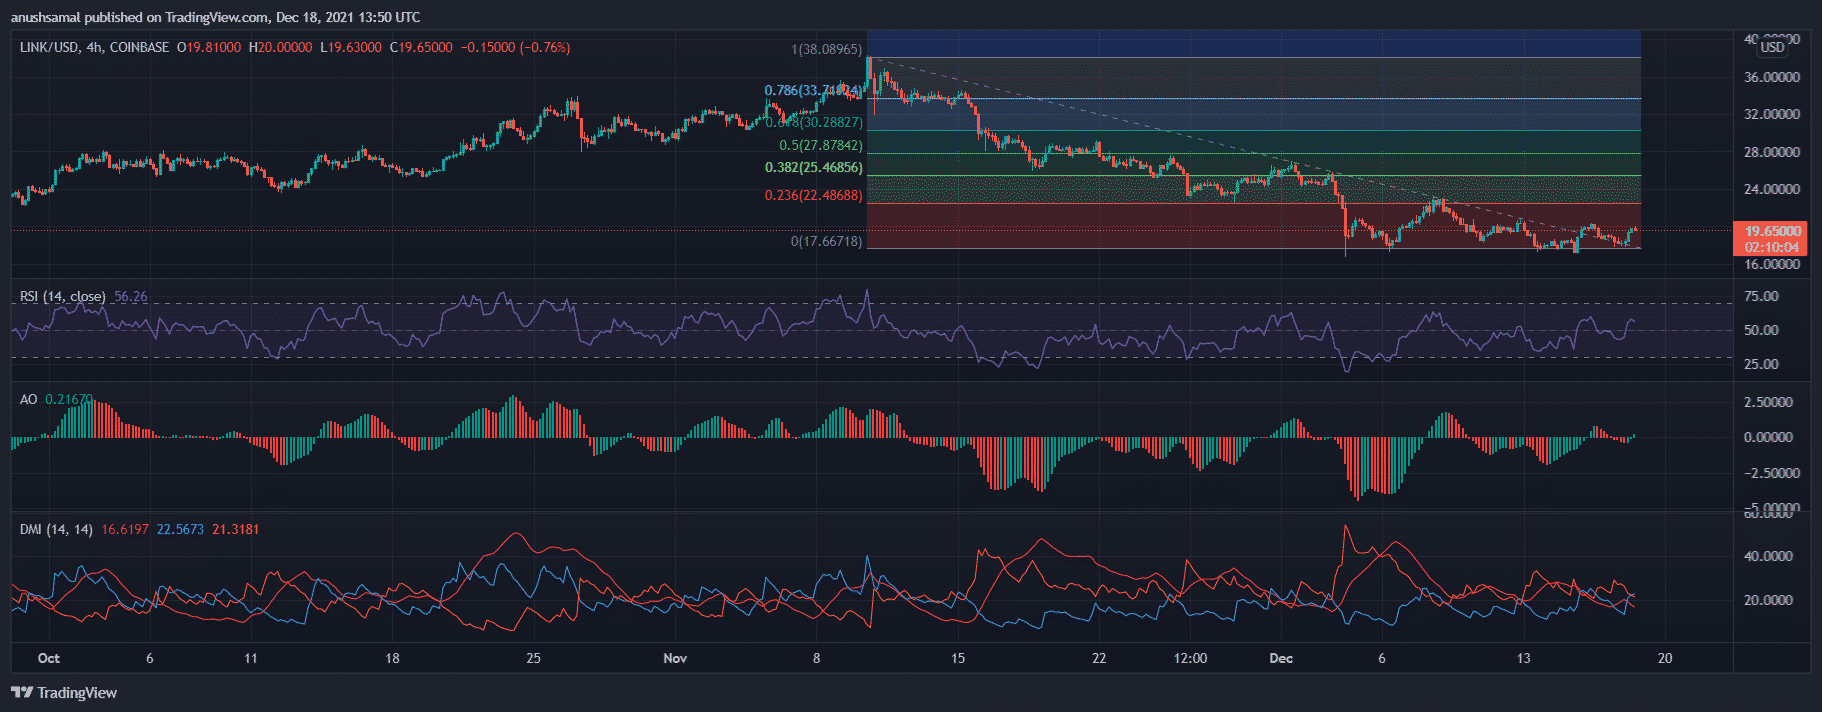
Chainlink witnessed an appreciation of 5.9% over the past day. The token previously made such short-lived comebacks, but those sessions were mostly met with bearish price action right after. In the past week, however, Chainlink has mainly seen gains, indicating that the bulls hadn’t completely fizzled out from the market. Although the token displayed bullish sentiments, it was trading beneath its long-standing support level of $20.
The digital currency had been struggling to move past the 23.6% Fibonacci level. The coin’s immediate resistance point waited at $22.48. The Relative Strength Index traveled above the half-line, indicating positive price action as buyers have exceeded sellers. Awesome, Oscillator’s green signal bars were a sign of bullish push in the market. The Directional Movement Index experienced a bullish crossover in the last 24 hours.
CAKE/USD Four-Hour Chart

Pancakeswap had consistently seen a descending price channel ever since November 8, and the coin was struggling to move over the immediate resistance level of $12.93. In the last 24 hours, Pancakeswap recorded 4.7% appreciation. With a continued push from the bulls, the coin could topple over the price mentioned above resistance. The additional strong resistance points for CAKE were at $14.59 and $16.72.
The Relative Strength Index was strong and recovered from the bearish zone at the time of writing. Directional Movement Index affirmed the bullish force and inclined towards a positive price action. MACD depicted possible inversion of red histograms into green histograms.

Why Trust CoinGape
CoinGape has covered the cryptocurrency industry since 2017, aiming to provide informative insights Read more… to our readers. Our journal analysts bring years of experience in market analysis and blockchain technology to ensure factual accuracy and balanced reporting. By following our Editorial Policy, our writers verify every source, fact-check each story, rely on reputable sources, and attribute quotes and media correctly. We also follow a rigorous Review Methodology when evaluating exchanges and tools. From emerging blockchain projects and coin launches to industry events and technical developments, we cover all facets of the digital asset space with unwavering commitment to timely, relevant information.

Delivered every day.
- Insights that move markets
- 100,000 active subscribers
Related Articles


- Crypto Prices Surge Today: BTC, ETH, XRP, SOL Soar Despite US Government Shutdown
- CLARITY Act: Crypto Group Challenges Banks Proposal With Its Own Bill Suggestions
- Trump’s Truth Social Files For Bitcoin, Ethereum, Cronos Crypto ETFs Amid Institutional Outflows
- Trump Tariffs: U.S. Supreme Court Sets February 20 for Potential Tariff Ruling
- Brazil Targets 1M BTC Strategic Reserve to Rival U.S. Bitcoin Stockpile
- XRP Price Prediction Ahead of Potential U.S. Government Shutdown Today
- Bitcoin Price Outlook As Gold And Silver Lose $3.6 Trillion in Market Value
- XRP and Ethereum Price Prediction as Trump Seeks to Lower Key Tariffs
- Solana Price Prediction as $2.6 Trillion Citi Expands Tokenized Products to SOL
- Bitcoin Price Could Fall to $50,000, Standard Chartered Says — Is a Crash Coming?
- Cardano Price Prediction Ahead of Midnight Mainnet Launch


