Raydium (RAY) Price Analysis: Solana Based RAY Up 30% Over Last Week, Next target $15?


- RAY is up over 30% the last week
- Price has formed an ascending channel
- RAY is being held up by the 40 MA
SOL Gang is On Rise
Raydium (RAY) is a new token that was launched in early 2021. Raydium (RAY) just underwent a Binance listing in mid August which has caused a healthy price spike since. The use case for RAY is very appealing to many investors as it is natively hosted on the Solana blockchain. Raydium describes itself as an automated market maker & liquidity provider for the Serum decentralized exchange (DEX). This coin seems to have much potential as the interest in the SOL blockchain as well as decentralized exchanges have skyrocketed recently.
Ever since RAY was listed on Binance, the price has been in a strong uptrend. Over the past week, RAY price attempted a breakout above its major resistance zone & hit nearly $17 in less than an hour. Quickly afterwards, bears pulled RAY all the way back under its major resistance zone found from $12.90-$13.77.
At the time of writing, RAY price is attempting to break the first level of this major resistance zone. If this is deemed successful, RAY price will likely spike back above the $16 mark.
RAY Price Analysis: RAY/USDT 4 Hour Chart
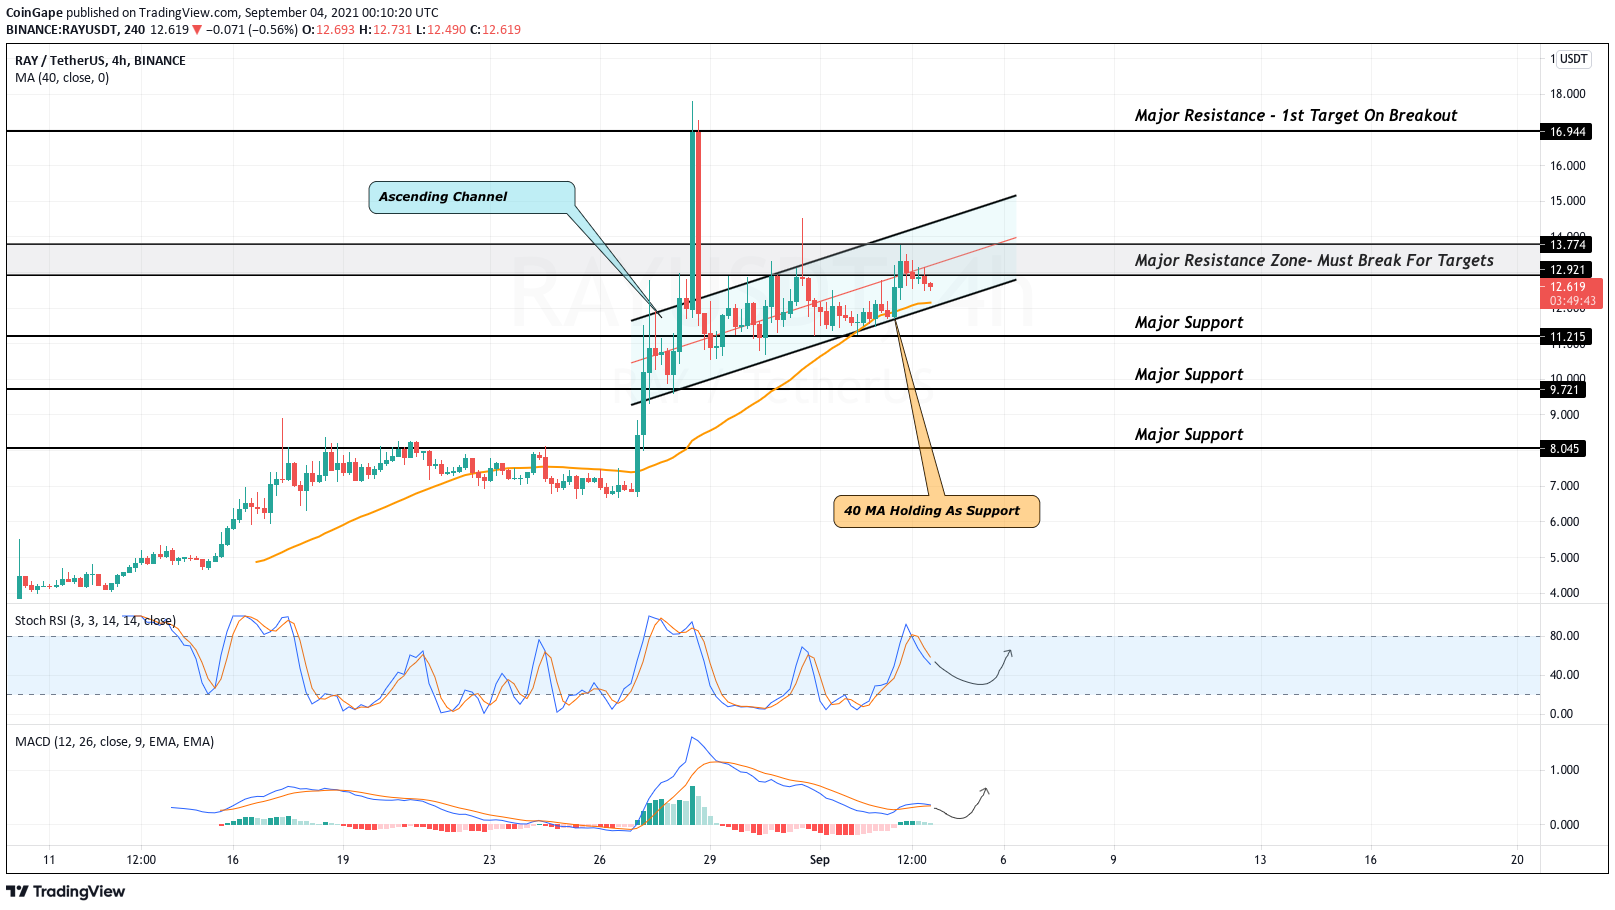
Over the past week, price has formed an ascending channel formation (shown in blue). Each time price touches either trend, it has gotten rejected back into the channel. A full break & retest of one of the trends of the channel is needed for price to break free. Yesterday, Raydium (RAY) touched its 40MA which has held as support for over two weeks. If bulls fail to break & hold the major resistance zone & RAY price gets pulled below its ascending channel, price will likely enter a downtrend. We should expect to look for a support bounce between $10-$11.
- While looking at the Stochastic RSI, we can see that strength has just gotten rejected within the overbought region & it seems to be holding the 50 value as support. As long as strength stays over the 50 value, RAY price will continue in a bullish stance. If strength breaks below this level, RAY will likely enter a short term downtrend.
- The MACD has been heading down towards the 0 value for almost a week now & the histogram is about to tick bearish. As long as the MA’s hold above the 0 value, RAY price will continue its bull trend.
RAY Intraday Analysis
- Spot rate: $12.73
- Trend: Sideways
- Volatility: Medium
- Support: $12.12
- Resistance: $12.92

Why Trust CoinGape
CoinGape has covered the cryptocurrency industry since 2017, aiming to provide informative insights Read more… to our readers. Our journal analysts bring years of experience in market analysis and blockchain technology to ensure factual accuracy and balanced reporting. By following our Editorial Policy, our writers verify every source, fact-check each story, rely on reputable sources, and attribute quotes and media correctly. We also follow a rigorous Review Methodology when evaluating exchanges and tools. From emerging blockchain projects and coin launches to industry events and technical developments, we cover all facets of the digital asset space with unwavering commitment to timely, relevant information.
Delivered every day.
- Insights that move markets
- 100,000 active subscribers
Related Articles


- Will Bitcoin Crash Again as ‘Trump Insider’ Whale Dumps 6,599 BTC
- XRP News: Ripple’s RLUSD Gets Boost as CFTC Expands Approved Tokenized Collateral
- Crypto Markets Brace as Another Partial U.S. Government Shutdown Looms Next Week
- $40B Bitcoin Airdrop Error: Bithumb to Reimburse Customer Losses After BTC Crash To $55k
- ETH Price Fears Major Crash As Trend Research Deposits $1.8B Ethereum to Binance
- Cardano Price Prediction as Midnight Token Soars 15%
- Bitcoin and XRP Price Outlook Ahead of Crypto Market Bill Nearing Key Phase on Feb 10th
- Bitcoin Price Prediction as Funding Rate Tumbles Ahead of $2.1B Options Expiry
- Ethereum Price Outlook as Vitalik Buterin Sells $14 Million Worth of ETH: What’s Next for Ether?
- Solana Price at Risk of Crashing Below $50 as Crypto Fear and Greed Index Plunges to 5
- Pi Network Price Prediction Ahead of PI KYC Validator Reward System Launch


