SAND and Mana Price Analysis: Metaverse Tokens Positive Today


Metaverse tokens have seen quite the year, with coins securing massive ROIs and appreciation in this month particularly. These metaverse coins have moved up their charts, displaying bullish sentiments at press time. Over the last 24 hours, SANDBOX soared 5.5%, while Decentraland secured a 3.9% gain.
These coins have encountered a recovery and have been successful at undoing some of the losses they have incurred over the past week. At press time, SAND was trading for $6.08, and MANA was exchanging hands for $3.38.
SAND/USD Four Hour Chart
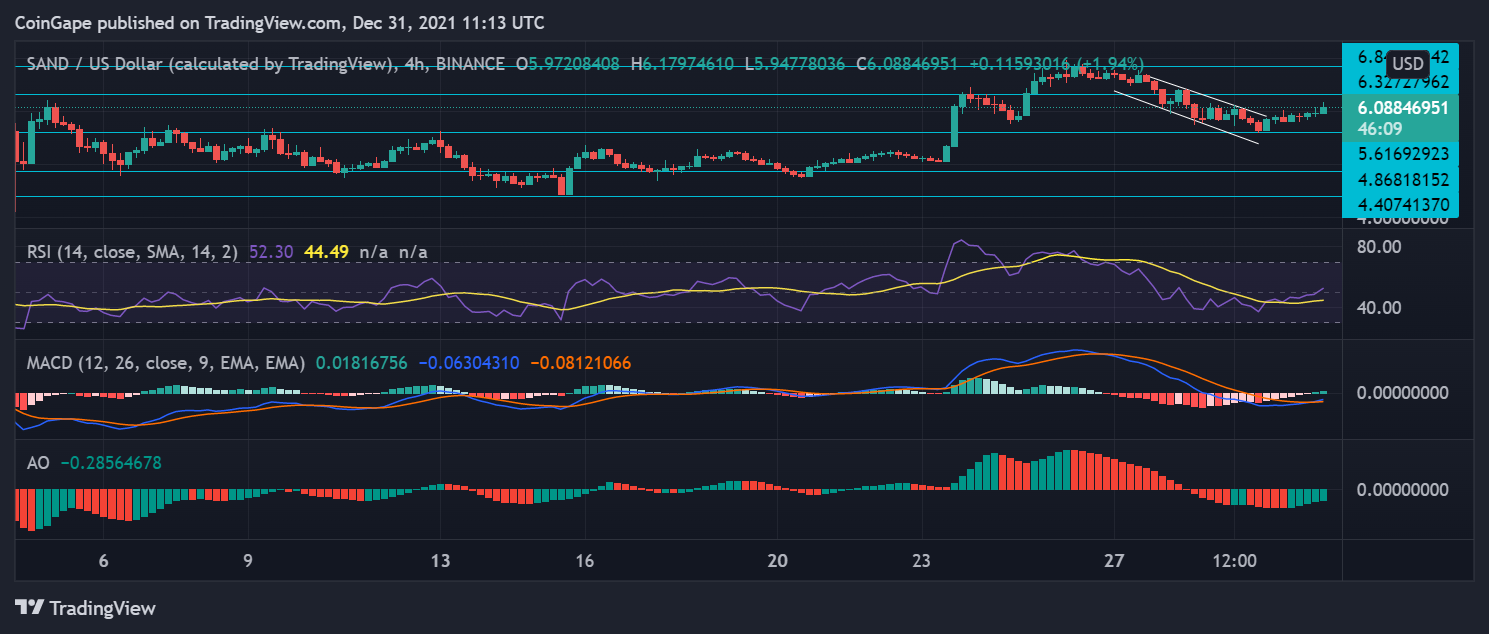
SANDBOX was trading within a descending price channel. The coin over the last 24 hours broke from the descending channel. The immediate price level stood at $6.33, going above which the coin could attempt to trade near the $6.80 price mark.
On the flip side, a fall in buying strength would push SAND down to $5.61, and additional support lines stood at $4.86. Sandbox appreciated since December 23, and the coin maintained the bullish stance.
The Relative Strength Index rose slightly above the half-line, indicating bullishness as buyers entered the market after a sell-off period. MACD flashed green histograms after a bullish crossover signaling at northward price action in the market.
Awesome Oscillator displayed green histograms in consonance with the bulls in the market.
MANA/USD Four Hour Chart
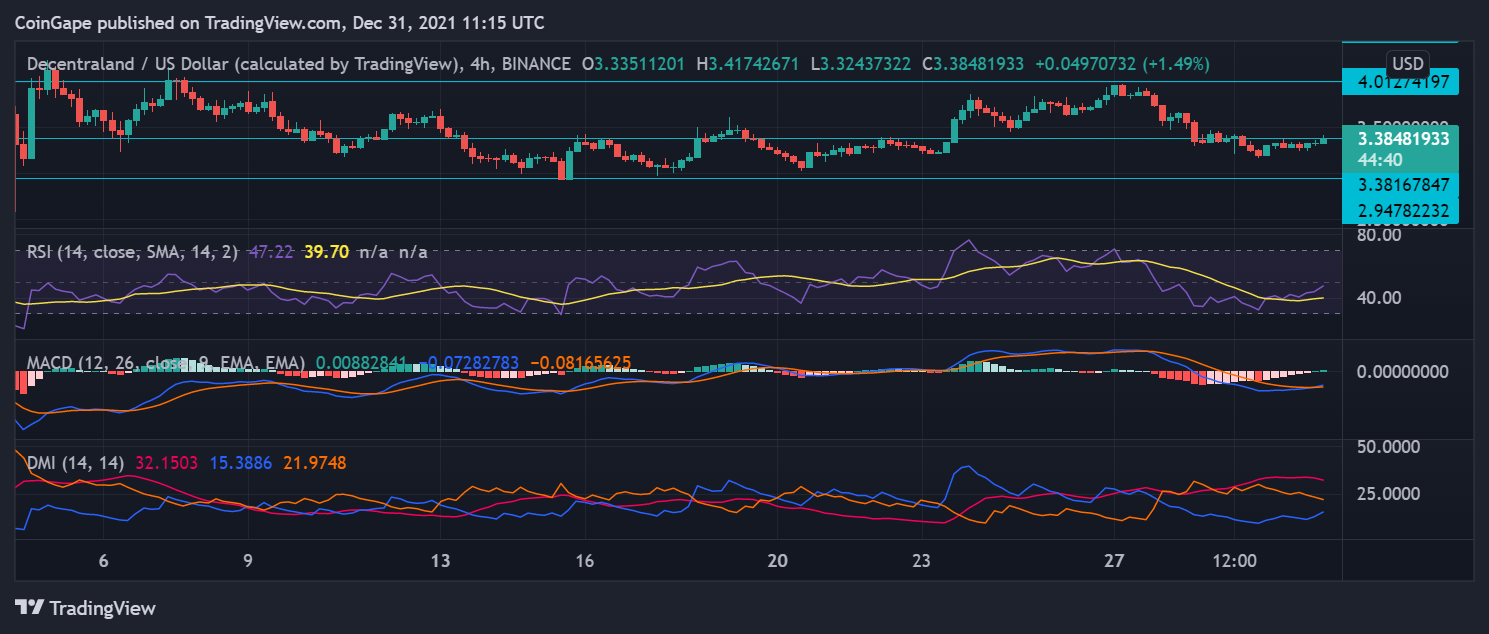
Decentraland was trading at $3.38 after it rose by 3.8% over the last 24 hours. Overhead resistance for the coin stood at $4.01, and the support line was at $2.94. Near term, technicals indicated bullishness. If the coin maintained a bullish stance, MANA could target a 17% growth in future trading sessions.
MANA has been volatile. However, the coin has adequately displayed recovery on its charts too. The $2.94 level has been acting as strong support for the coin for quite some time over this month.
The Relative Strength Index moved slightly over the half-line as the coin witnessed buyers coming into the market after a sell-off. MACD flashed a green histogram following the positive price momentum in the market.
The Directional Movement Index was bearish and yet to see a bullish crossover. The ADX, however, displayed a weakening of the price trend. This reading indicated that there could be a price reversal.

Why Trust CoinGape
CoinGape has covered the cryptocurrency industry since 2017, aiming to provide informative insights Read more… to our readers. Our journal analysts bring years of experience in market analysis and blockchain technology to ensure factual accuracy and balanced reporting. By following our Editorial Policy, our writers verify every source, fact-check each story, rely on reputable sources, and attribute quotes and media correctly. We also follow a rigorous Review Methodology when evaluating exchanges and tools. From emerging blockchain projects and coin launches to industry events and technical developments, we cover all facets of the digital asset space with unwavering commitment to timely, relevant information.

Delivered every day.
- Insights that move markets
- 100,000 active subscribers
Related Articles


- Trump Tariffs: U.S. Supreme Court Sets February 20 for Potential Tariff Ruling
- Brazil Targets 1M BTC Strategic Reserve to Rival U.S. Bitcoin Stockpile
- Breaking: U.S. CPI Inflation Falls To 4-Year Low Of 2.4%, Bitcoin Rises
- Bitget Launches Gracy AI For Market Insights Amid Crypto Platforms Push For AI Integration
- BlackRock Signals $257M Bitcoin and Ethereum Sell-Off Ahead of Partial U.S. Government Shutdown
- Bitcoin Price Outlook As Gold And Silver Lose $3.6 Trillion in Market Value
- XRP and Ethereum Price Prediction as Trump Seeks to Lower Key Tariffs
- Solana Price Prediction as $2.6 Trillion Citi Expands Tokenized Products to SOL
- Bitcoin Price Could Fall to $50,000, Standard Chartered Says — Is a Crash Coming?
- Cardano Price Prediction Ahead of Midnight Mainnet Launch
- Pi Network Price Prediction as Mainnet Upgrade Deadline Nears on Feb 15


