Solana, Polkadot and VeChain Remain Bullish; Near Term Technicals Suggest Uptrend


Bitcoin’s price was above the $51k mark; as soon as the coin had displayed bullish sentiments, other altcoins reflected the same price movements. Solana, Polkadot, and VeChain have displayed continued bullishness on their charts.
Over the last seven days, these coins specifically have soared substantially, logging double-digit gains. All the coins have now stood above their immediate price floors. These coins could topple over their immediate resistance lines with the continued uptrend.
Solana/USD Four-Hour Chart
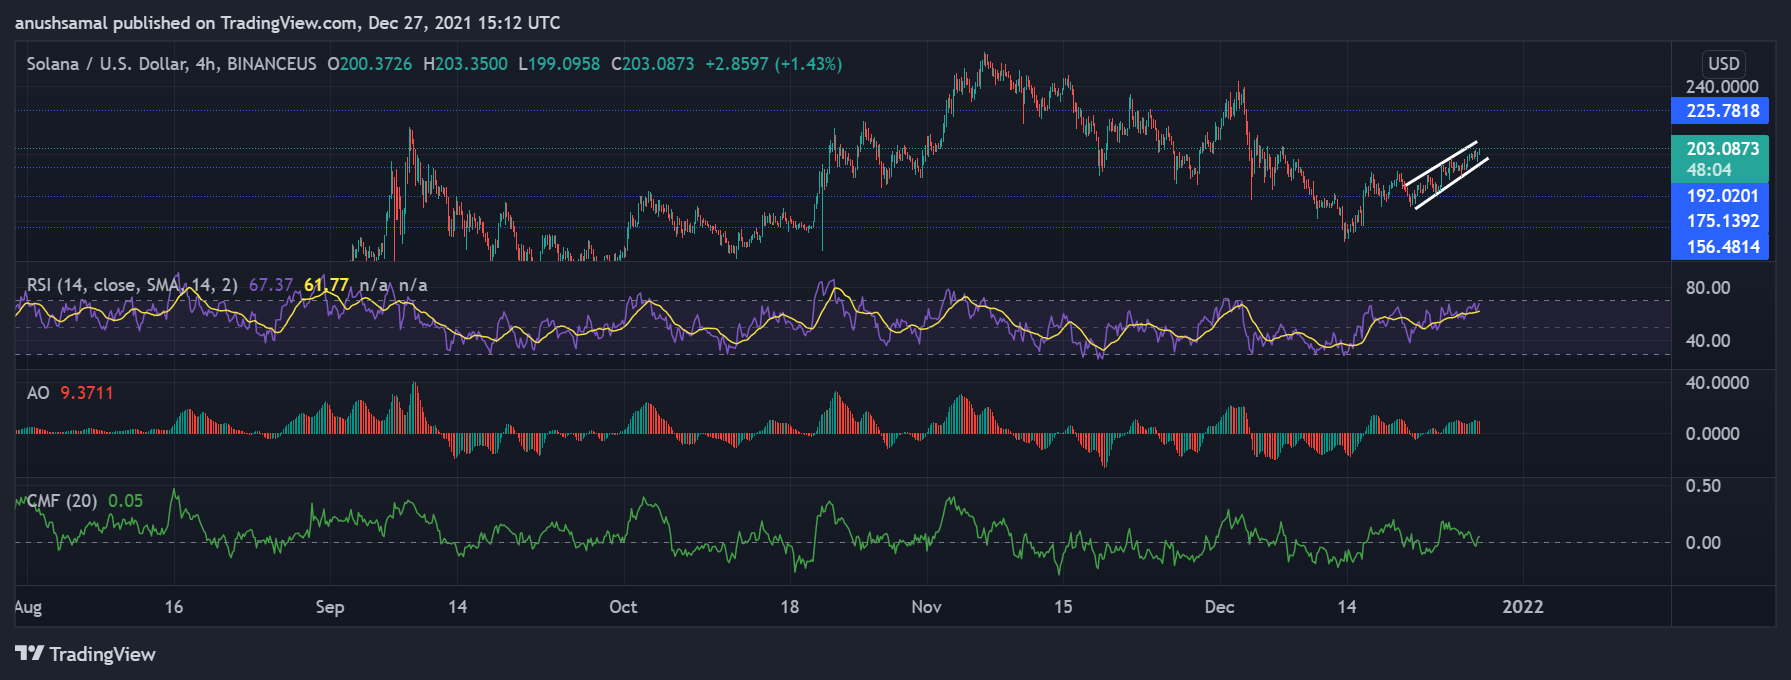
Solana’s price trajectory was sandwiched between an ascending channel, although Sol’s price action has formed an ascending wedge that can possibly amount to an upcoming bearish pressure. The immediate price floor stood at $203.08, falling beneath which the coin can trade at $192.02.
Although the coin can possibly display a bearish price action, near-term technicals have pointed towards bullish price action.
The Relative Strength Index was positive, above the midline as the buyers have entered the market. The Awesome Oscillator displayed red histograms in anticipation of bearish price action. Chaikin Money Flow was also above the midline as capital outflows have decreased over the past few days.
If the price pullback doesn’t happen over the upcoming trading sessions, then the overhead resistance stands at $225.78.
DOT/USD Four-Hour Chart
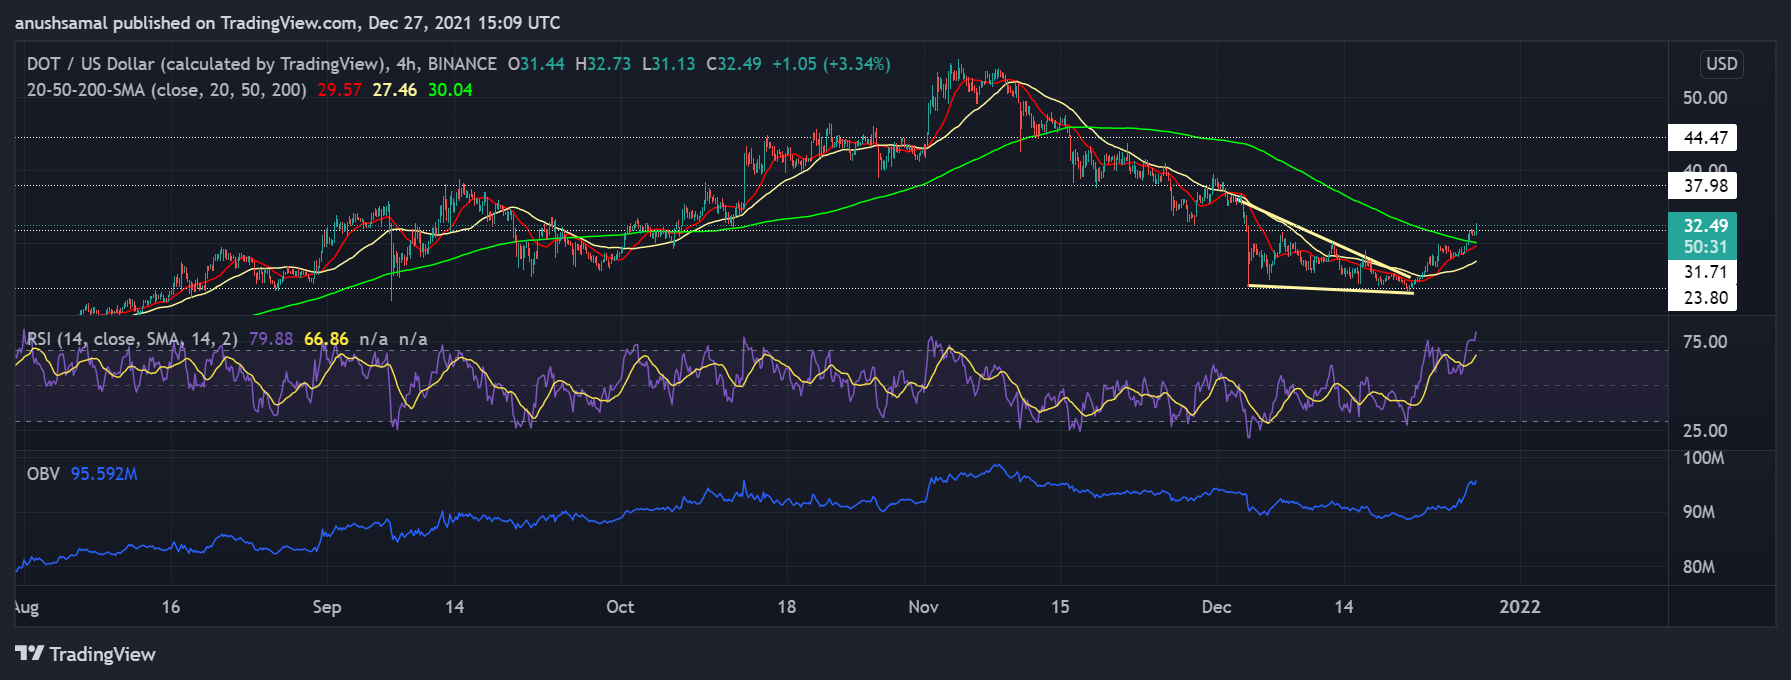
Polkadot’s price stood at $32.49 after the coin traded and formed a descending wedge, signaling a bullish price action. Over the last week, DOT rose by 26.6%, and over the previous 24 hours, the coin appreciated over 11%.
An upward push from the bulls can cause the coin to trade near the resistance level of $37.98, breaking above which DOT could trade near the $44.47 level. DOT has been bullish, and the coin price stood above the 200 SMA too, which is indicative of positive price action.
The immediate support level of the coin was $31.71. The Relative Strength was above the half-line as the coin was in the overbought zone. On Balance, Volume was also bullish as buying pressure took over in the market as the coin was overvalued at the time of writing.
VET/USD Four-Hour Chart
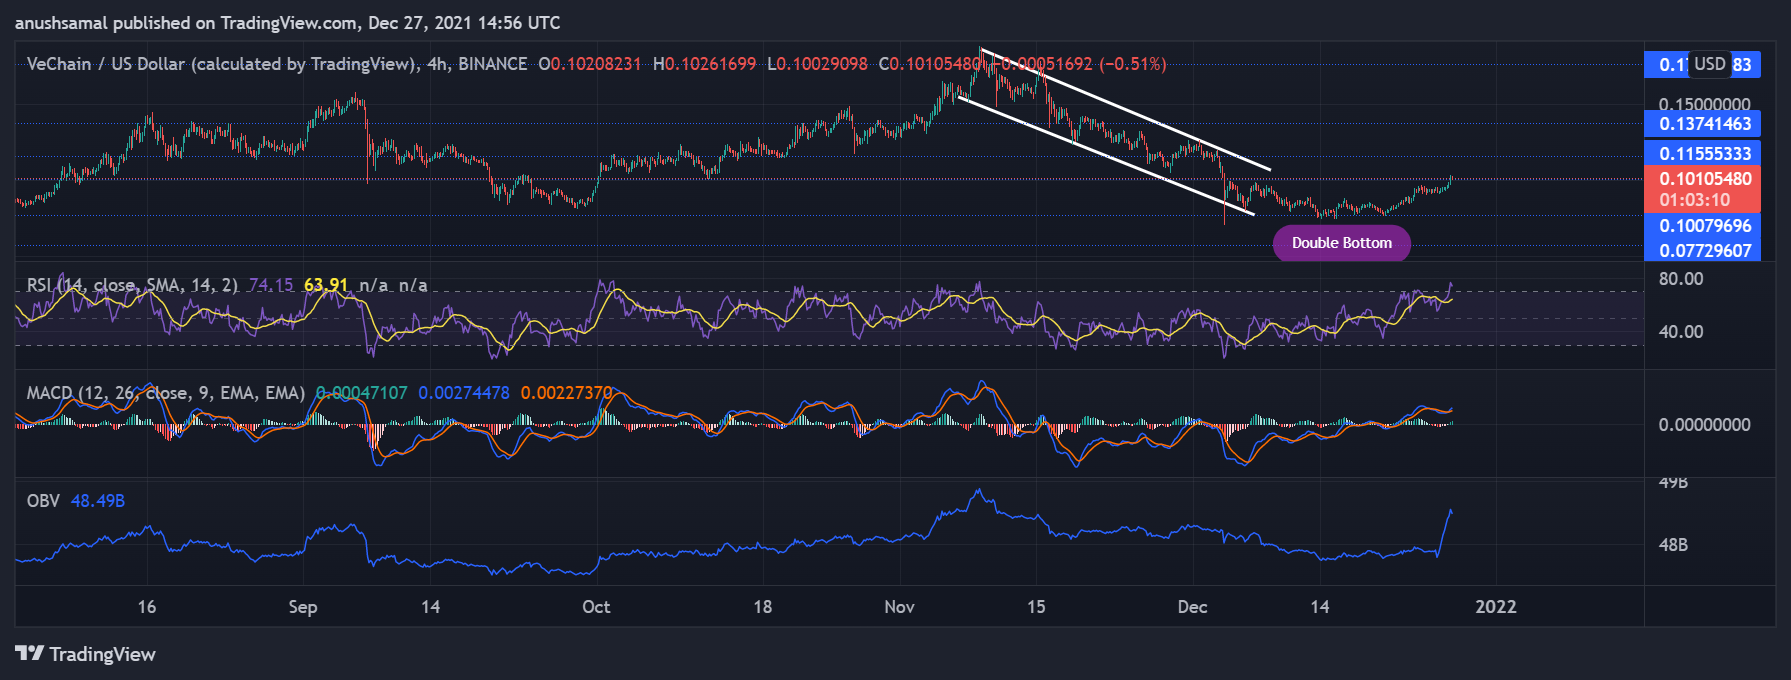
VeChain was trading at $0.101 at press time; over the last few days, it witnessed a mundane price action and then ended up forming a double bottom pattern. This pattern signified an upcoming price action, which happened as the coin again broke past its support level of $0.100.
Immediate price resistance that VET could encounter stood at $0.115 and toppling which the coin could attempt to trade near the $0.137 mark. On the flip side, the coin could find support at $0.77.
The Relative Strength Index stood above the 80-mark as the asset was overbought and overvalued. This is the second time the Relative Strength Index was seen touching this mark as the indicator last felt the 80-mark at the beginning of November.
MACD underwent a bullish crossover as green histograms were visible. Balance Volume shot up steeply as buying strength resurfaced over the last 24 hours.

Why Trust CoinGape
CoinGape has covered the cryptocurrency industry since 2017, aiming to provide informative insights Read more… to our readers. Our journal analysts bring years of experience in market analysis and blockchain technology to ensure factual accuracy and balanced reporting. By following our Editorial Policy, our writers verify every source, fact-check each story, rely on reputable sources, and attribute quotes and media correctly. We also follow a rigorous Review Methodology when evaluating exchanges and tools. From emerging blockchain projects and coin launches to industry events and technical developments, we cover all facets of the digital asset space with unwavering commitment to timely, relevant information.
Delivered every day.
- Insights that move markets
- 100,000 active subscribers
Related Articles


- India’s Crypto Taxation Unchanged as the Existing 30% Tax Retains
- Crypto News: Strategy Bitcoin Underwater After 30% BTC Crash
- Expert Predicts Ethereum Crash Below $2K as Tom Lee’s BitMine ETH Unrealized Loss Hits $6B
- Bitcoin Falls Below $80K as Crypto Market Sees $2.5 Billion In Liquidations
- Top Reasons Why XRP Price Is Dropping Today
- Here’s Why MSTR Stock Price Could Explode in February 2026
- Bitcoin and XRP Price Prediction After U.S. Government Shuts Down
- Ethereum Price Prediction As Vitalik Withdraws ETH Worth $44M- Is a Crash to $2k ahead?
- Bitcoin Price Prediction as Trump Names Kevin Warsh as new Fed Reserve Chair
- XRP Price Outlook Ahead of Possible Government Shutdown
- Ethereum and XRP Price Prediction as Odds of Trump Attack on Iran Rise


