Solana Price Leads Altcoin Rally As Ethereum Futures ETFs Debut In The US – Time To Buy SOL?
Solana price bulls increased their presence in the market up 4.5% to trade at $24 on Monday. This bullish outlook started with the hype around the US Securities and Exchange Commission (SEC) greenlighting the first Ether futures exchange-traded funds (ETFs).
Investors have from Friday increased exposure to cryptos, triggering rallies across the board but more significantly with Bitcoin (BTC) above $28,000, Ethereum above $1,700, and Solana above $24.
Solana Price On the Verge of Validating Move To $30
Solana price is facing a crossroads where it might validate another breakout to $30, or invalidate the uptrend due to resistance at $25. According to the microenvironment on the daily chart, a bullish outcome is highly likely.
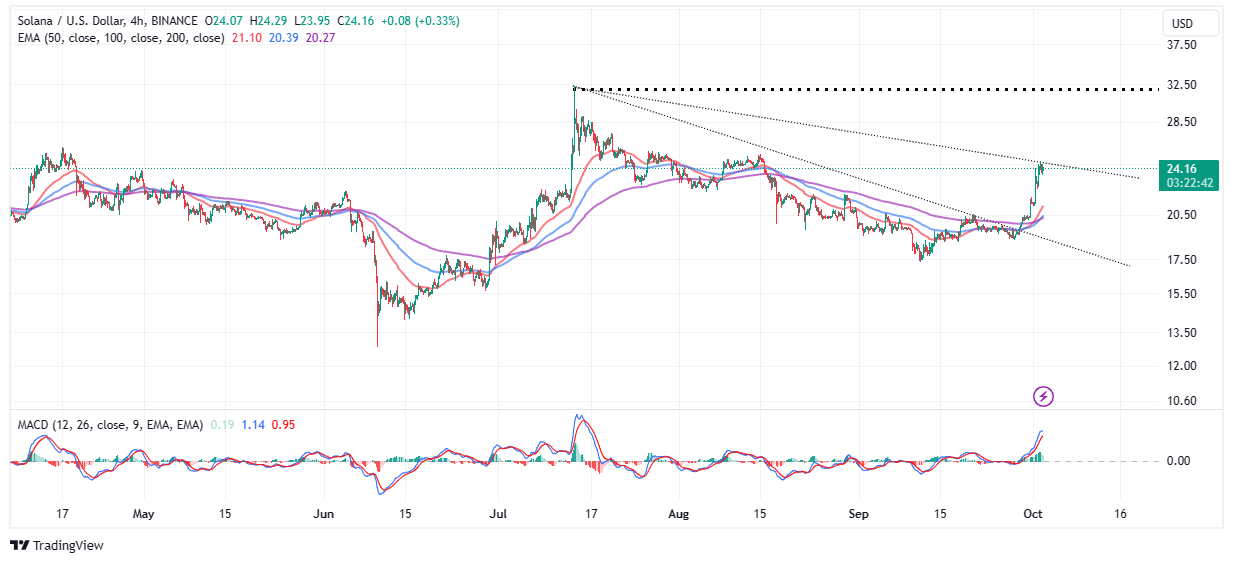
A buy signal from the Moving Average Convergence Divergence (MACD) indicator upholds the bullish outlook with a buy signal.
However, traders with ongoing exposure to long positions in SOL may be more interested in the position of the momentum indicator – currently above the mean line (0.00). As the MACD ascends into the positive region, traders are encouraged to keep their positions open bolstered by the expectation of an extended breakout to $30.
Solana’s position above all three moving averages, starting with the 50-day Exponential Moving Average (EMA) (red), the 100-day EMA (blue), and the 200-day EMA (purple) reveals that buyers have the upper hand.
In other words, there is a higher probability of the uptrend carrying on above $25 and closing the distance to $30 than dropping below $20.
TradingBrokersView, an anonymous analyst on Tradingview, has recently highlighted a repeated trend, where Solana price has broken several falling trendline resistances, rallied and formed a bullish/bearish fractal pattern before retracing.
According to the analyst, “all two prior breakouts over such Resistance in the past 12 months have ended with a new Higher High on our main Channel Up pattern.” Hence, the likelihood of the ongoing breakout stretching to $33 before correcting and holding onto higher support, preferably above $25.
Invalidating Solana Price Bullish Outlook
The resistance at $25 coincides with a descending trendline on the four-hour chart. To continue with the uptrend, Solana must break above this barricade, otherwise, there will be a significant level of risk, with Solana retreating to seek support and liquidity toward $20.
Traders should also ponder the technical outlook from the aspect of the currently bullish MACD indicator. Following a sharp move above the mean line (0.00) to +1.13, a trend reversal is likely. In other words, there is the need to prepare for a sudden pullback, with the backing of the Relative Strength Index (RS) if it starts retreating from the resistance area or is overbought.
Related Articles
- BREAKING: Grayscale Files with SEC To Convert Its Ethereum Trust to Spot Ethereum ETF
- Uptober Rally: Bitcoin Breaks $28k As US Avoids Government Shutdown
- Key Levels to Watch for ETH Price Before Ethereum Futures ETF Launch
Recent Posts
- Crypto News
BlackRock Bitcoin ETF Ranks Among Top ETFs In 2025 Despite Crypto Downturn
The BlackRock Bitcoin ETF (IBIT) has emerged as one of the top exchange-traded funds (ETF)…
- Crypto News
Stablecoin Adoption Deepens as Klarna Turns to Coinbase for Institutional Liquidity
Klarna has taken a major step into crypto finance by partnering with Coinbase to accept…
- Crypto News
Ripple, Circle Could Gain Fed Access as Board Seeks Feedback on ‘Skinny Master Account’
The U.S. Federal Reserve has requested public feedback on the payment accounts, also known as…
- Crypto News
Fed’s Williams Says No Urgency to Cut Rates Further as Crypto Traders Bet Against January Cut
New York Federal Reserve President John Williams has signaled his support for holding rates steady…
- Crypto News
Trump to Interview BlackRock’s Rick Rieder as Fed Chair Shortlist Narrows to Four
The Fed chair race is heating up with U.S. President Donald Trump set to interview…
- Crypto News
Breaking: VanEck Discloses Fees and Staking Details for its Avalanche ETF
The leading crypto asset manager VanEck amends its Avalanche ETF with the U.S. Securities and…