XDC Hits Weekly High Amid US Treasury Token Offering Debut


Since Tradeteq’s tokenized US Treasury offering debuted on Tuesday’s layer 1 blockchain XDC Network, positive momentum has been dominant. As a result, the XDC price increased from an intra-day low of $0.05929 in the previous 24 hours to a 7-day high of $0.06659 before encountering resistance.
This price increase may be attributed to increased interest, demand for tokenized US Treasury offerings, and the market’s positive outlook. If the $0.06659 resistance level is broken, the next resistance level for the XDC price might be around $0.07000. However, a pullback or consolidation period may occur before the price resumes its upward rally.
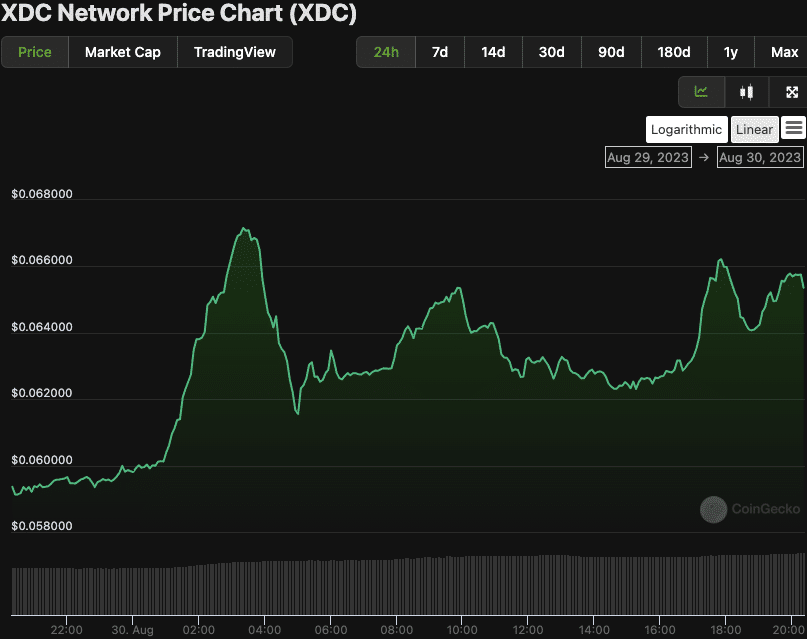
XDC/USD 1-day price chart (source: CoinGecko)
During the bull run, XDC’s market capitalization and 24-hour trading volume increased by 8.48% and 30.47%, respectively, to $895,110,754 and $14,775,539. This increase shows a significant flood of investors and trading activity in XDC, further supporting its rising trend.
XDC Technical Analysis
The Bollinger bands on the 4-hour price chart are broadening and rising higher, indicating the possibility of more volatility and upward movement in XDC’s price. The upper and lower Bollinger band intersections at $0.06850202 and $0.04627758, respectively, evidence the bullish trend.
With the price action near the upper band, XDC is currently trading at a relatively high level and may experience a temporary pullback or consolidation before potentially continuing its upward trend.
 Source: TradingView
Furthermore, with a reading of 57.22, the stochastic RSI is moving below its signal line and drifting south, indicating a likely decline in purchasing pressure. This pattern lends credence to a possible price drop for XDC, as investors may take profits and wait for a better entry time.
Additionally, the Relative Strength Index at 68.14, XDC is approaching overbought territory, indicating that the current uptrend is losing steam, and a correction may be coming. If the RSI remains above 70, it will reinforce the overbought situation and raise the chances of a market reversal.
While XDC’s positive momentum is evident, caution is advised as indicators suggest a potential pullback due to profit-taking and overbought signals.

Why Trust CoinGape
CoinGape has covered the cryptocurrency industry since 2017, aiming to provide informative insights Read more… to our readers. Our journal analysts bring years of experience in market analysis and blockchain technology to ensure factual accuracy and balanced reporting. By following our Editorial Policy, our writers verify every source, fact-check each story, rely on reputable sources, and attribute quotes and media correctly. We also follow a rigorous Review Methodology when evaluating exchanges and tools. From emerging blockchain projects and coin launches to industry events and technical developments, we cover all facets of the digital asset space with unwavering commitment to timely, relevant information.

Delivered every day.
- Insights that move markets
- 100,000 active subscribers